OPEN-SOURCE SCRIPT
更新済 EMA pullback strategy
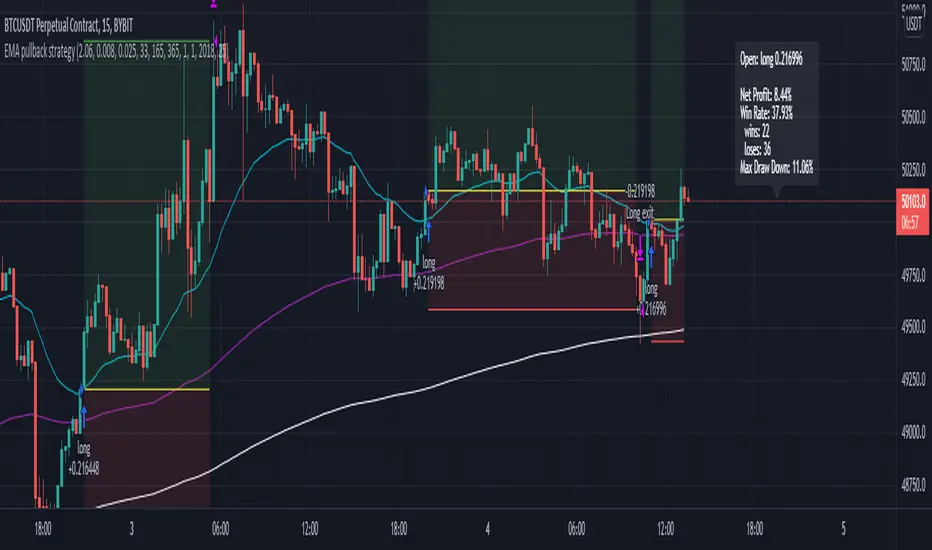
A solid EMA pullback strategy for cryptos 15 min chart that uses EMA crossing as signal and pullback as stop loss.
EMA1: shortest period for finding crossing (I find period = 33 profitable for BTCUSD, you can adjust it for other cryptos)
EMA2: 5x period of EMA1, for filtering out some trend reversals
EMA3: 11x period of EMA1, for determining trend direction
Rules are:
Long:
close price > EMA3
EMA1 > EMA3
close price pullbacks below EMA1 and then crosses up EMA1, enter at the first close price above EMA1
lowest pullback close price < EMA2 at the cross up
Short:
close price < EMA3
EMA1 < EMA3
close price pullbacks above EMA1 and then crosses down EMA1, enter at the first close price below EMA1
highest pullback close price > EMA2 at the cross down
Stop-loss at lowest/highest pullback price for long/short
Take profit = 2x stop-loss
Risk management: risk range can be set in the inspector. If the risk is lower than the range, the trade is not taken. if the risk is higher than the range, the position size is adjusted to keep the risk within range.
リリースノート
cosmetic updateオープンソーススクリプト
TradingViewの精神に則り、このスクリプトの作者はコードをオープンソースとして公開してくれました。トレーダーが内容を確認・検証できるようにという配慮です。作者に拍手を送りましょう!無料で利用できますが、コードの再公開はハウスルールに従う必要があります。
免責事項
この情報および投稿は、TradingViewが提供または推奨する金融、投資、トレード、その他のアドバイスや推奨を意図するものではなく、それらを構成するものでもありません。詳細は利用規約をご覧ください。
オープンソーススクリプト
TradingViewの精神に則り、このスクリプトの作者はコードをオープンソースとして公開してくれました。トレーダーが内容を確認・検証できるようにという配慮です。作者に拍手を送りましょう!無料で利用できますが、コードの再公開はハウスルールに従う必要があります。
免責事項
この情報および投稿は、TradingViewが提供または推奨する金融、投資、トレード、その他のアドバイスや推奨を意図するものではなく、それらを構成するものでもありません。詳細は利用規約をご覧ください。