OPEN-SOURCE SCRIPT
Normalized Equity/Bond Ratio
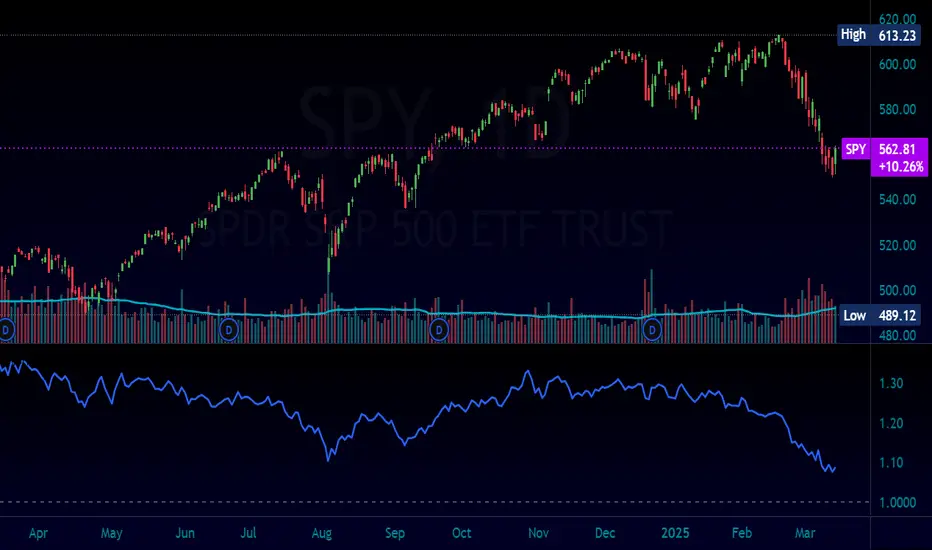
This indicator calculates a normalized equity-to-bond ratio over a 252-day lookback (~1 trading year) to assess risk-on vs. risk-off sentiment. It addresses the issue of direct ratios (e.g., SPY/TLT) being visually dominated by high nominal stock prices, which can obscure bond price movements.
A rising ratio indicates equities are outperforming bonds, suggesting risk-on conditions, while a declining ratio signals a shift toward bonds, often associated with risk-off behavior. The normalization ensures better visibility and comparability of the trend over time.
A ratio > 1 means the equity (e.g., SPY) is outperforming the bond (e.g., AGG) since the lookback. A ratio < 1 means bonds are outperforming.
オープンソーススクリプト
TradingViewの精神に則り、このスクリプトの作者はコードをオープンソースとして公開してくれました。トレーダーが内容を確認・検証できるようにという配慮です。作者に拍手を送りましょう!無料で利用できますが、コードの再公開はハウスルールに従う必要があります。
免責事項
この情報および投稿は、TradingViewが提供または推奨する金融、投資、トレード、その他のアドバイスや推奨を意図するものではなく、それらを構成するものでもありません。詳細は利用規約をご覧ください。
オープンソーススクリプト
TradingViewの精神に則り、このスクリプトの作者はコードをオープンソースとして公開してくれました。トレーダーが内容を確認・検証できるようにという配慮です。作者に拍手を送りましょう!無料で利用できますが、コードの再公開はハウスルールに従う必要があります。
免責事項
この情報および投稿は、TradingViewが提供または推奨する金融、投資、トレード、その他のアドバイスや推奨を意図するものではなく、それらを構成するものでもありません。詳細は利用規約をご覧ください。