OPEN-SOURCE SCRIPT
更新済 Logarithmic Volume
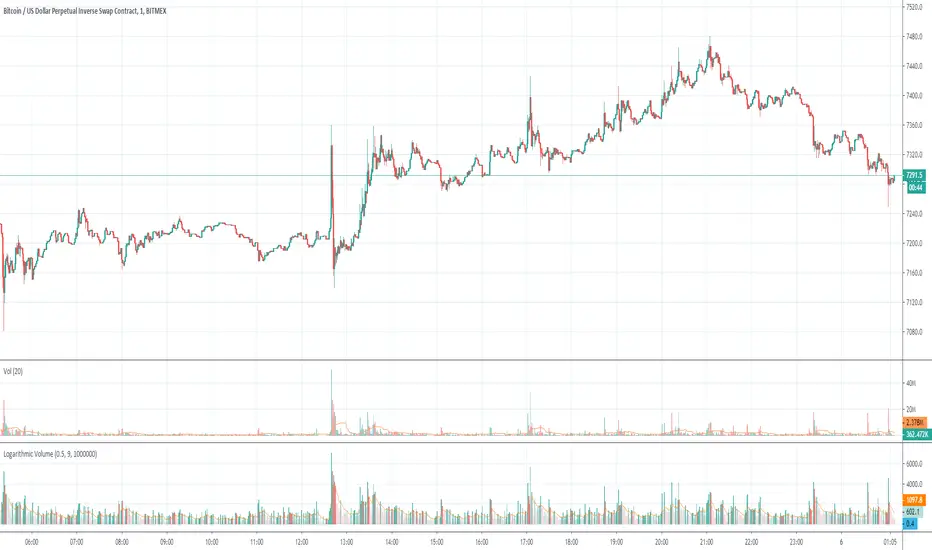
In volatile markets, normal indicator suffer from volume spikes that make the rest of plot seem non-existent.
Using logarithmic exponent, this indicator normalizes the volume, so this makes it easier to read.
The obvious drawback is that it does not display the actual volume amount, only a relative value.
Using logarithmic exponent, this indicator normalizes the volume, so this makes it easier to read.
The obvious drawback is that it does not display the actual volume amount, only a relative value.
リリースノート
Included the original volume indicator in the screenshot so you can see the difference.リリースノート
Fixed incorrect bar colors, note: it's actually intended to be green on rising volume and red on declining volume.リリースノート
I found the way to include the original volume data on the chart!The actual volume is being divided by a large number, so it doesn't break the chart.
The outcome value is small and transparent, yet it's still printed on the chart.
In this example it is divided by 1000000 or one million bitmex contracts.
オープンソーススクリプト
TradingViewの精神に則り、このスクリプトの作者はコードをオープンソースとして公開してくれました。トレーダーが内容を確認・検証できるようにという配慮です。作者に拍手を送りましょう!無料で利用できますが、コードの再公開はハウスルールに従う必要があります。
免責事項
この情報および投稿は、TradingViewが提供または推奨する金融、投資、トレード、その他のアドバイスや推奨を意図するものではなく、それらを構成するものでもありません。詳細は利用規約をご覧ください。
オープンソーススクリプト
TradingViewの精神に則り、このスクリプトの作者はコードをオープンソースとして公開してくれました。トレーダーが内容を確認・検証できるようにという配慮です。作者に拍手を送りましょう!無料で利用できますが、コードの再公開はハウスルールに従う必要があります。
免責事項
この情報および投稿は、TradingViewが提供または推奨する金融、投資、トレード、その他のアドバイスや推奨を意図するものではなく、それらを構成するものでもありません。詳細は利用規約をご覧ください。