OPEN-SOURCE SCRIPT
Volume Voids [theUltimator5]
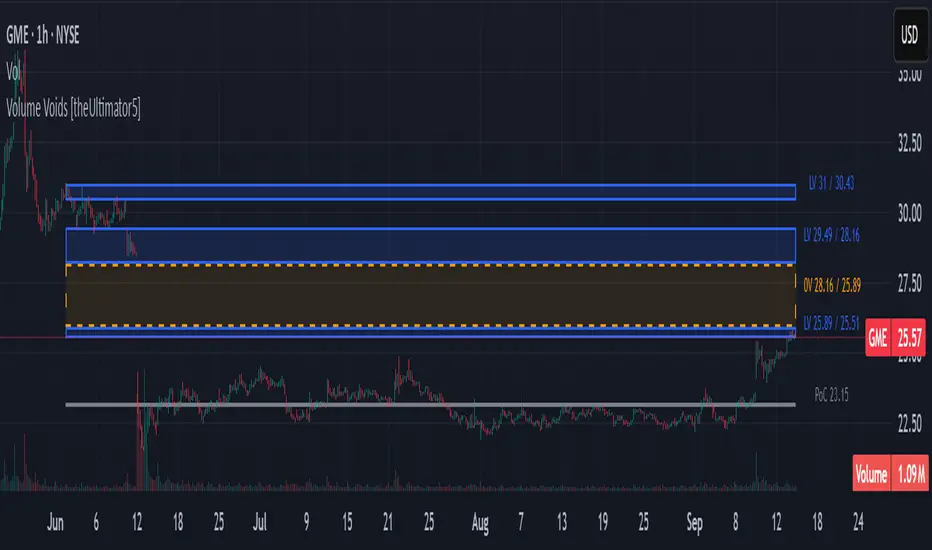
Volume Voids highlights price regions with no or unusually thin participation over a chosen lookback. It bins the lookback’s full price range into equal steps, assigns each bar’s close to a bin, and accumulates volume per bin. Contiguous runs of zero-volume bins are shown as “voids,” while low-volume runs (below a dynamic threshold) mark thin-liquidity “corridors” where price often traverses quickly when revisited.
An optional PoC (Point of Control) line marks the mid-price of the highest-volume bin—commonly treated as a recent “value” area that price may revisit.
What it draws on your chart
How it works
Note: This is a lightweight, chart-native approximation of a volume profile. Volume is binned by bar close (not by tick-level prints or intrabar distribution), so “voids”/“thin” areas reflect this approximation.
Key inputs
How to use (educational, not signals)
Limitations & performance
Bins use closing price only; intrabar distribution is not modeled.
Detections refresh on the live bar; visuals can be heavy on large lookbacks/high bin counts—reduce bins/lookback or hide labels if needed.
An optional PoC (Point of Control) line marks the mid-price of the highest-volume bin—commonly treated as a recent “value” area that price may revisit.
What it draws on your chart
- Histogram (optional): Right-anchored horizontal volume-by-price bars built from your lookback and bin count. Bars tint green→red via a simple delta proxy (up-bar volume minus down-bar volume) to hint at directional participation inside each price band.
- Point of Control (optional): A horizontal line at the highest-volume bin’s mid-price (the PoC).
- Zero-Volume Voids: Translucent boxes where no bin volume printed within the window (detected between the first and last non-empty bins).
- Low-Volume Zones: Translucent boxes where bin volume is below a dynamic threshold (see formula below), often acting like low-friction corridors.
How it works
- Slice the lookback’s high→low into N equal price bins.
- Assign each bar’s closing price to a bin and add that bar’s volume to the bin total. A simple up/down-bar delta proxy drives the histogram’s tinting.
- PoC = bin with the maximum accumulated volume.
- Zero-Volume Voids = contiguous runs of bins with exactly zero volume (bounded by the first/last occupied bins).
- Low-Volume Zones = contiguous runs of bins with volume below:
threshold = total_window_volume ÷ (divisor × number_of_bins)Lower divisor → more LV boxes; higher divisor → stricter/fewer boxes.
Note: This is a lightweight, chart-native approximation of a volume profile. Volume is binned by bar close (not by tick-level prints or intrabar distribution), so “voids”/“thin” areas reflect this approximation.
Key inputs
- Lookback Period: Window for calculations.
- Number of Volume Boxes (bins): Histogram resolution.
- PoC / Show Histogram / Anchor to Right Side: Visibility and layout controls.
- Low-Volume Threshold Divisor: Sensitivity for LV detection.
- Colors & Labels: Customize zero-volume / low-volume box colors and optional labels with offsets.
How to use (educational, not signals)
- Context: High-volume = acceptance; thin/zero-volume = inefficiency. Price often rotates near acceptance and moves faster through thin areas.
- Revisits: On returns to prior voids/LV zones, watch for accelerated moves or fills; PoC can serve as a balance reference.
- Confluence: Pair with trend tools (e.g., ADX), VWAP/session markers, or structure levels for timing and risk.
Limitations & performance
Bins use closing price only; intrabar distribution is not modeled.
Detections refresh on the live bar; visuals can be heavy on large lookbacks/high bin counts—reduce bins/lookback or hide labels if needed.
オープンソーススクリプト
TradingViewの精神に則り、このスクリプトの作者はコードをオープンソースとして公開してくれました。トレーダーが内容を確認・検証できるようにという配慮です。作者に拍手を送りましょう!無料で利用できますが、コードの再公開はハウスルールに従う必要があります。
免責事項
この情報および投稿は、TradingViewが提供または推奨する金融、投資、トレード、その他のアドバイスや推奨を意図するものではなく、それらを構成するものでもありません。詳細は利用規約をご覧ください。
オープンソーススクリプト
TradingViewの精神に則り、このスクリプトの作者はコードをオープンソースとして公開してくれました。トレーダーが内容を確認・検証できるようにという配慮です。作者に拍手を送りましょう!無料で利用できますが、コードの再公開はハウスルールに従う必要があります。
免責事項
この情報および投稿は、TradingViewが提供または推奨する金融、投資、トレード、その他のアドバイスや推奨を意図するものではなく、それらを構成するものでもありません。詳細は利用規約をご覧ください。