OPEN-SOURCE SCRIPT
Mayer Multiple (with muti-color histogram)
This is inspired by unbound's work on the Mayer Multiple script.
This script is designed to work with the daily chart.

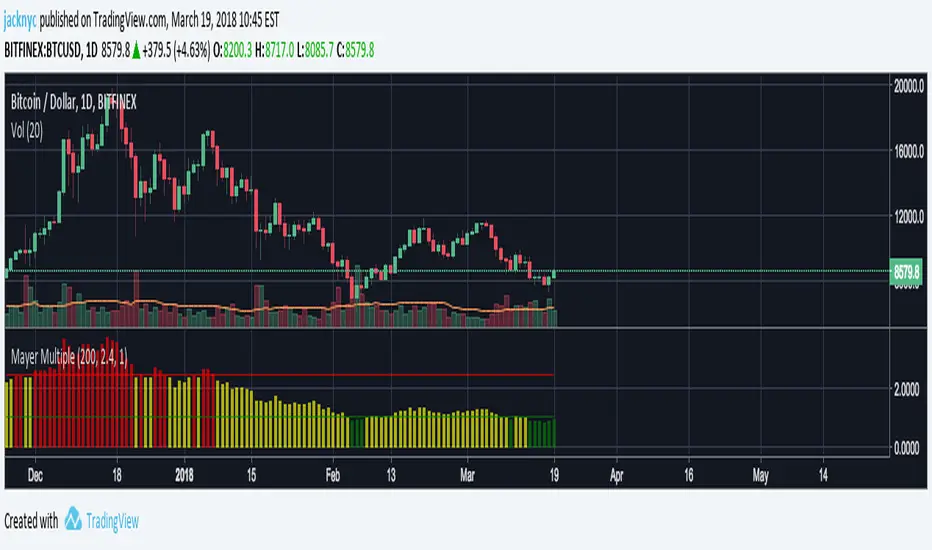
I created this script so you can see the daily Mayer Multiple by just hovering over the bar in the histogram. I modified the color of the histogram bar to indicate the following:
Red = Over 2.4x Mayer Multiple, overvalued
Yellow = Between 1x to 2.4x Mayer Mutiple, fairly valued
Green = Under 1x Mayer Multiple, undervalued
This is my first script so let me know if there are any issues or suggestions on how to change it.
This script is designed to work with the daily chart.
I created this script so you can see the daily Mayer Multiple by just hovering over the bar in the histogram. I modified the color of the histogram bar to indicate the following:
Red = Over 2.4x Mayer Multiple, overvalued
Yellow = Between 1x to 2.4x Mayer Mutiple, fairly valued
Green = Under 1x Mayer Multiple, undervalued
This is my first script so let me know if there are any issues or suggestions on how to change it.
オープンソーススクリプト
TradingViewの精神に則り、このスクリプトの作者はコードをオープンソースとして公開してくれました。トレーダーが内容を確認・検証できるようにという配慮です。作者に拍手を送りましょう!無料で利用できますが、コードの再公開はハウスルールに従う必要があります。
免責事項
この情報および投稿は、TradingViewが提供または推奨する金融、投資、トレード、その他のアドバイスや推奨を意図するものではなく、それらを構成するものでもありません。詳細は利用規約をご覧ください。
オープンソーススクリプト
TradingViewの精神に則り、このスクリプトの作者はコードをオープンソースとして公開してくれました。トレーダーが内容を確認・検証できるようにという配慮です。作者に拍手を送りましょう!無料で利用できますが、コードの再公開はハウスルールに従う必要があります。
免責事項
この情報および投稿は、TradingViewが提供または推奨する金融、投資、トレード、その他のアドバイスや推奨を意図するものではなく、それらを構成するものでもありません。詳細は利用規約をご覧ください。