OPEN-SOURCE SCRIPT
SR Intensity Candle
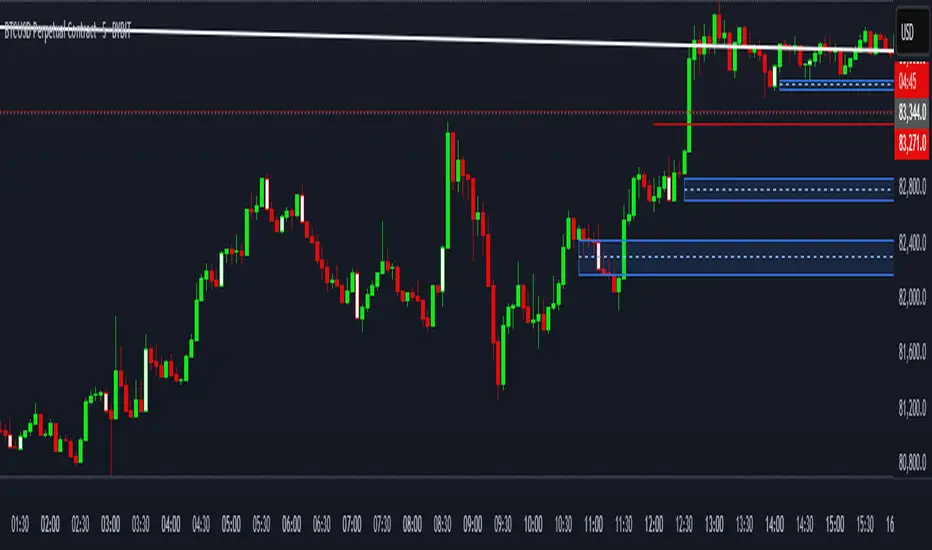
This is a very simple script intended to find just what the title says, "Intensity Candles" is what i am calling them. A bullish intensity candle is taking the low of the previous candle and the close is above the previous candle high. Bearish intensity candle is the opposite, a candle that takes the high of the previous candle and the close is below the low of the previous candle.
Alternatively, if a "bullish" intensity candle is the mitigated and price pushes below, you can expect a back test short of the "bullish" intensity candle. They will act as SR zones for the future price action.
The BEST and most ideal spot for the intensity candles to happen is the see a bullish candle at the low of a move and a bearish candle at the highs indicating strong movement for reversal.
オープンソーススクリプト
TradingViewの精神に則り、このスクリプトの作者はコードをオープンソースとして公開してくれました。トレーダーが内容を確認・検証できるようにという配慮です。作者に拍手を送りましょう!無料で利用できますが、コードの再公開はハウスルールに従う必要があります。
免責事項
この情報および投稿は、TradingViewが提供または推奨する金融、投資、トレード、その他のアドバイスや推奨を意図するものではなく、それらを構成するものでもありません。詳細は利用規約をご覧ください。
オープンソーススクリプト
TradingViewの精神に則り、このスクリプトの作者はコードをオープンソースとして公開してくれました。トレーダーが内容を確認・検証できるようにという配慮です。作者に拍手を送りましょう!無料で利用できますが、コードの再公開はハウスルールに従う必要があります。
免責事項
この情報および投稿は、TradingViewが提供または推奨する金融、投資、トレード、その他のアドバイスや推奨を意図するものではなく、それらを構成するものでもありません。詳細は利用規約をご覧ください。