OPEN-SOURCE SCRIPT
Donchian Trend Signals
アップデート済
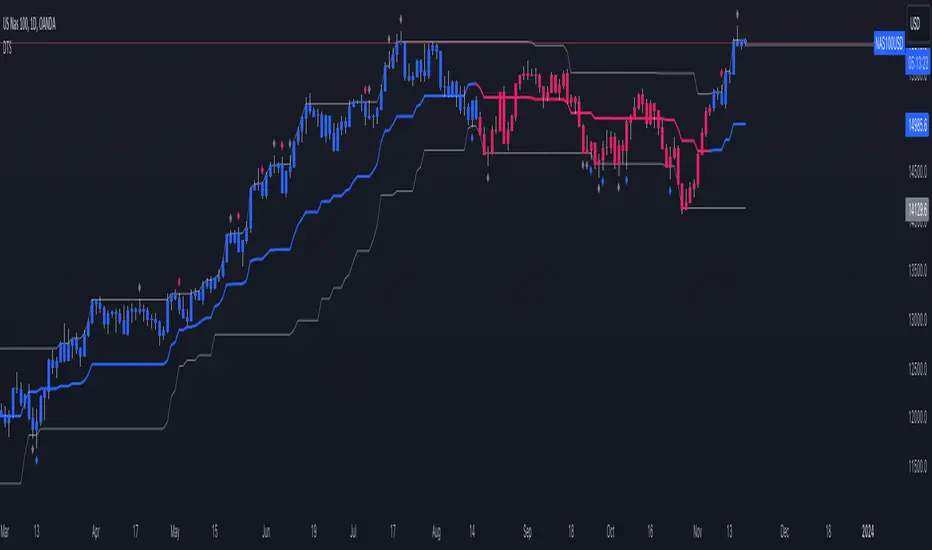
The Donchian Trend Signals is an indicator developed to help traders identify the current trend direction and potential liquidity grabs.
The usage of the indicator is very simple, on the chart you'll see a modified version of the classic and popular Donchian channel, calculated using the closing prices, that changes the color of the average middle line to indicate the direction of the current trend. The indicator also colors the candlestick.
Using the option "Complex Mode" will give your indicator additional data by changing the calculation method. These changes make the lines become the average between different lengths of the same Donchian channel formula.
Additionally, the indicator plots on the chart some buy or sell signals, displayed as diamonds above or below the candles. The signals are calculated to find potential liquidity grabs using the wicks, the true range of the candles, and the volume compared to his average value.
リリースノート
Breakout signals added: Breakout occurs whenever the closing price crosses above or below the Donchian lines. The color of the breakout signals, displayed as triangles in the direction of the breakout, depends on the decisiveness of the candle responsible for the breakout.リリースノート
Added the option to use Closing prices instead of Highs and Lowsオープンソーススクリプト
TradingViewの精神に則り、このスクリプトの作者は、トレーダーが理解し検証できるようにオープンソースで公開しています。作者に敬意を表します!無料で使用することができますが、このコードを投稿で再利用するには、ハウスルールに準拠する必要があります。 お気に入りに登録してチャート上でご利用頂けます。
免責事項
これらの情報および投稿は、TradingViewが提供または保証する金融、投資、取引、またはその他の種類のアドバイスや推奨を意図したものではなく、またそのようなものでもありません。詳しくは利用規約をご覧ください。