OPEN-SOURCE SCRIPT
Tycoon Gann
Currently this script will work for the stocks and futures price trading in between 1000 - 100000. In our future update we will add another feature that will give you access to all the price digit stocks futures and currencies too .
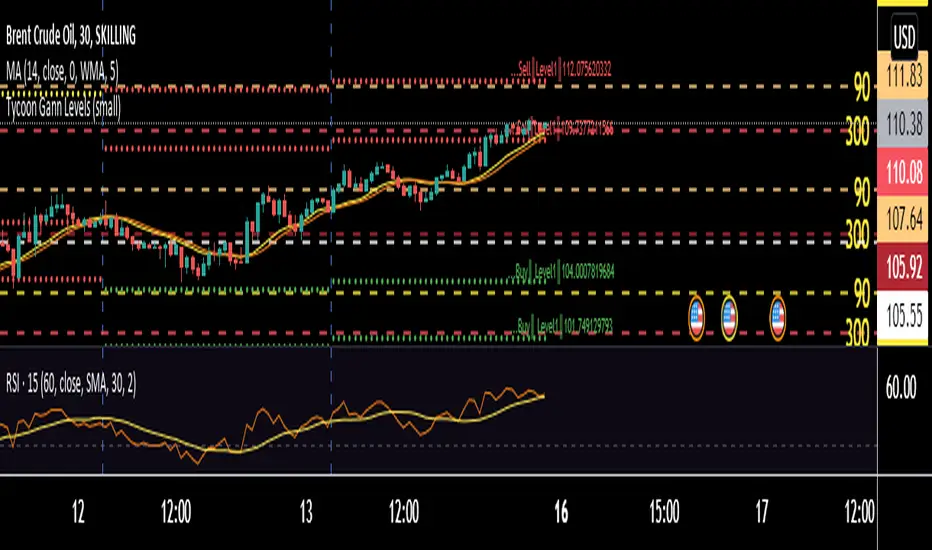
This is purely based on a secret method of Tycoon Infotek as a research of GANN levels we found in our experience these WD GANN Trend angle based calculations giving us some important hints to watch . Degree offset from previous close price add 90 degree to calculate resistance and substract 90 to get resistance levels . green color dots denotes buying pressure zone and red color denotes selling pressure zones . yellow line indicates neutral sign
These levels not only shows us the Support and resistance . It clearly intimate us the strength of selling and buying pressure naturally occurred once the price reaches the zones.
オープンソーススクリプト
TradingViewの精神に則り、このスクリプトの作者はコードをオープンソースとして公開してくれました。トレーダーが内容を確認・検証できるようにという配慮です。作者に拍手を送りましょう!無料で利用できますが、コードの再公開はハウスルールに従う必要があります。
免責事項
この情報および投稿は、TradingViewが提供または推奨する金融、投資、トレード、その他のアドバイスや推奨を意図するものではなく、それらを構成するものでもありません。詳細は利用規約をご覧ください。
オープンソーススクリプト
TradingViewの精神に則り、このスクリプトの作者はコードをオープンソースとして公開してくれました。トレーダーが内容を確認・検証できるようにという配慮です。作者に拍手を送りましょう!無料で利用できますが、コードの再公開はハウスルールに従う必要があります。
免責事項
この情報および投稿は、TradingViewが提供または推奨する金融、投資、トレード、その他のアドバイスや推奨を意図するものではなく、それらを構成するものでもありません。詳細は利用規約をご覧ください。