OPEN-SOURCE SCRIPT
Previous 4-Hour High/Low
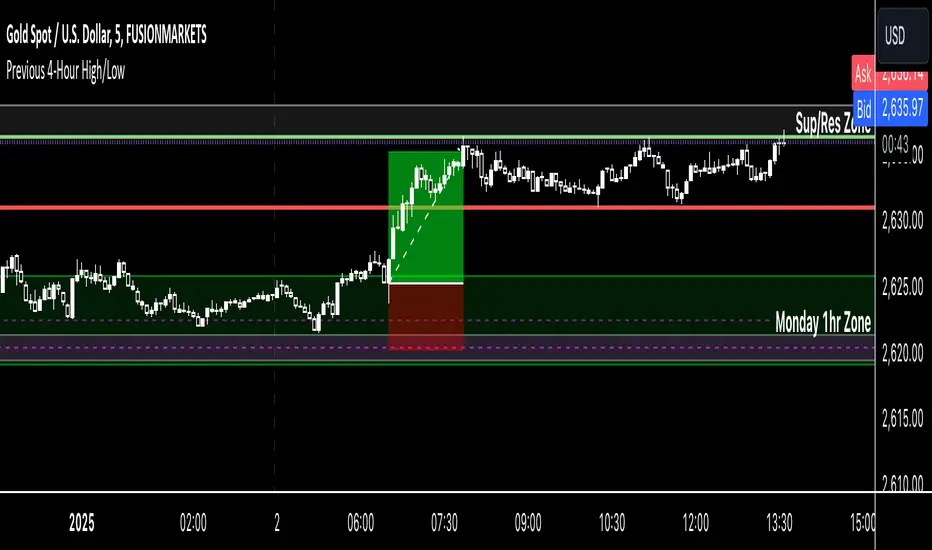
Indicator Name: Previous 4-Hour High/Low Lines
Description:
This indicator highlights the high and low levels of the previous candle from a user-defined timeframe (default: 4 hours) and extends these levels both to the left and right across the chart. It allows traders to visualize key support and resistance levels from higher timeframes while analyzing lower timeframe charts.
Key Features:
• Customizable Timeframe: Select any timeframe (e.g., 4-hour, daily) to track the high and low of the previous candle.
• Dynamic Updates: The high and low levels update automatically with each new candle.
• Extended Levels: Lines extend both left and right, providing a clear reference for past and future price action.
• Overlay on Chart: The indicator works seamlessly on any timeframe, making it ideal for multi-timeframe analysis.
Use Case:
This tool is perfect for traders who rely on higher timeframe levels for setting entry/exit points, identifying potential breakout zones, or managing risk. By visualizing these levels directly on lower timeframe charts, traders can make informed decisions without switching between charts.
オープンソーススクリプト
TradingViewの精神に則り、このスクリプトの作者はコードをオープンソースとして公開してくれました。トレーダーが内容を確認・検証できるようにという配慮です。作者に拍手を送りましょう!無料で利用できますが、コードの再公開はハウスルールに従う必要があります。
免責事項
この情報および投稿は、TradingViewが提供または推奨する金融、投資、トレード、その他のアドバイスや推奨を意図するものではなく、それらを構成するものでもありません。詳細は利用規約をご覧ください。
オープンソーススクリプト
TradingViewの精神に則り、このスクリプトの作者はコードをオープンソースとして公開してくれました。トレーダーが内容を確認・検証できるようにという配慮です。作者に拍手を送りましょう!無料で利用できますが、コードの再公開はハウスルールに従う必要があります。
免責事項
この情報および投稿は、TradingViewが提供または推奨する金融、投資、トレード、その他のアドバイスや推奨を意図するものではなく、それらを構成するものでもありません。詳細は利用規約をご覧ください。