OPEN-SOURCE SCRIPT
On Balance Volume Wave
Introducing an Enhanced Version of the Classic OBV Indicator
The On-Balance Volume (OBV) indicator is a well-known tool among traders, celebrated for its ability to track momentum by using volume flow to predict changes in stock price. For an overview of the original OBV indicator, please visit: https://www.tradingview.com/chart/?solution=43000502593.
What Makes This Version Different?
This enhanced version of the OBV indicator incorporates advanced signal processing techniques to bring new depth to market analysis. Here's what sets it apart:
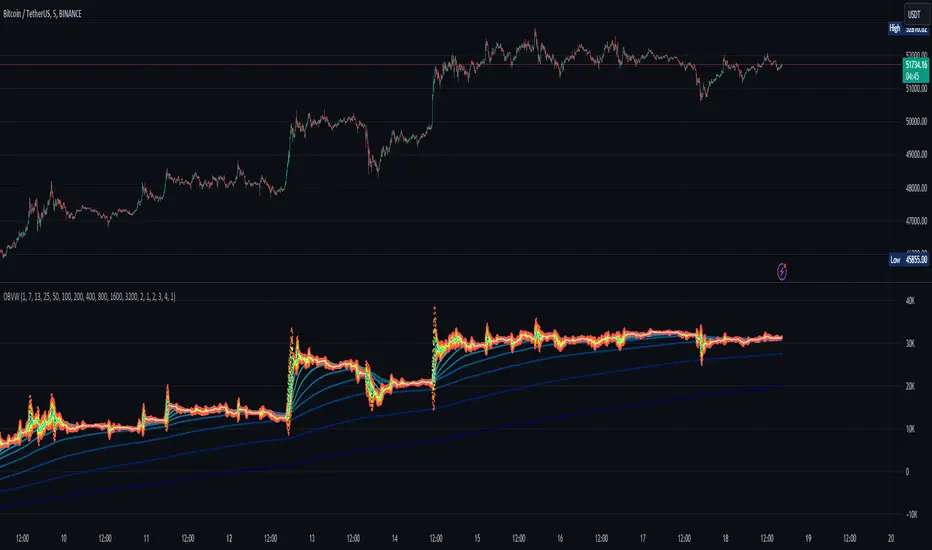
Standard Deviation Bands and EMAs: These additions to the OBV offer a visual representation of significant market movements—highlighting major pumps and dumps, as well as identifying potential support and resistance levels.
Color-Coded Insights: The standard deviation bands utilize color coding based on signal processing principles. This feature becomes increasingly useful the more you zoom out, making it easier to observe and interpret market waves.
Market Maker Activity: By examining fluctuations within the standard deviation bands, traders can gauge when Market Makers are actively maneuvering to establish their long and short positions, often at the expense of retail traders.
EMA Support and Resistance: The embedded Exponential Moving Averages (EMAs) serve as dynamic support and resistance levels. Analyzing these can help traders determine the continuing strength of a market move, whether bullish or bearish.
Visual Guide to the Basics
For a clearer understanding of what this enhanced indicator can show, please refer to the image below:

And in addition to all the above one can detect relevant W and M structures way easier with this indicator ;)
The On-Balance Volume (OBV) indicator is a well-known tool among traders, celebrated for its ability to track momentum by using volume flow to predict changes in stock price. For an overview of the original OBV indicator, please visit: https://www.tradingview.com/chart/?solution=43000502593.
What Makes This Version Different?
This enhanced version of the OBV indicator incorporates advanced signal processing techniques to bring new depth to market analysis. Here's what sets it apart:
Standard Deviation Bands and EMAs: These additions to the OBV offer a visual representation of significant market movements—highlighting major pumps and dumps, as well as identifying potential support and resistance levels.
Color-Coded Insights: The standard deviation bands utilize color coding based on signal processing principles. This feature becomes increasingly useful the more you zoom out, making it easier to observe and interpret market waves.
Market Maker Activity: By examining fluctuations within the standard deviation bands, traders can gauge when Market Makers are actively maneuvering to establish their long and short positions, often at the expense of retail traders.
EMA Support and Resistance: The embedded Exponential Moving Averages (EMAs) serve as dynamic support and resistance levels. Analyzing these can help traders determine the continuing strength of a market move, whether bullish or bearish.
Visual Guide to the Basics
For a clearer understanding of what this enhanced indicator can show, please refer to the image below:
And in addition to all the above one can detect relevant W and M structures way easier with this indicator ;)
オープンソーススクリプト
TradingViewの精神に則り、このスクリプトの作者は、トレーダーが理解し検証できるようにオープンソースで公開しています。作者に敬意を表します!無料で使用することができますが、このコードを投稿で再利用するには、ハウスルールに準拠する必要があります。 お気に入りに登録してチャート上でご利用頂けます。
Get access to our indicators at: huntergatherers.tech
免責事項
これらの情報および投稿は、TradingViewが提供または保証する金融、投資、取引、またはその他の種類のアドバイスや推奨を意図したものではなく、またそのようなものでもありません。詳しくは利用規約をご覧ください。