OPEN-SOURCE SCRIPT
Daily Volume Ratio Bands (20MA)
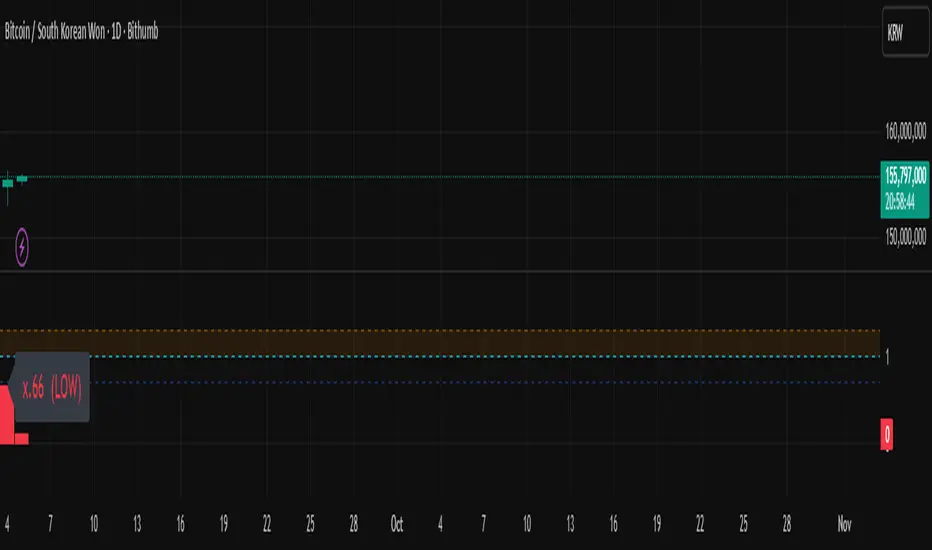
Daily Volume Ratio Bands (20MA) — by CryptoDaily
This indicator normalizes daily trading volume against the recent 20-day moving average (20MA) and plots it as a volume ratio.
It allows traders to quickly identify whether current volume is strong, weak, or within a normal range compared to historical averages.
Key Features
Normalized volume ratio with 20-day average = baseline (1.0)
Clear bands for easy interpretation (1.0 ~ 1.3 = normal, above = overheated, below = weak)
Intuitive color coding:
🟨 Yellow: Normal range (1.0 ~ 1.3)
🔵 Blue: Above 1.3× average (high/strong volume, breakout confirmation)
⚪️ Gray: Below average (low volume)
🔴 Red: At or below 0.7× (extremely low volume / lack of interest)
How to Use
Breakouts with strong volume (Blue) → higher confidence in trend continuation
Gray/Red during consolidation → signal of weak momentum or sideways phase
Quickly assess whether the market is in overheated or low-activity conditions
Notes
Designed for Daily timeframe (1D) only. It will not function properly on intraday charts.
For educational purposes only. This is not financial advice.
Author
CryptoDaily (YouTube & TradingView)
YouTube channel: cryptodaily_tv
オープンソーススクリプト
TradingViewの精神に則り、この作者はスクリプトのソースコードを公開しているので、その内容を理解し検証することができます。作者に感謝です!無料でお使いいただけますが、このコードを投稿に再利用する際にはハウスルールに従うものとします。
免責事項
これらの情報および投稿は、TradingViewが提供または保証する金融、投資、取引、またはその他の種類のアドバイスや推奨を意図したものではなく、またそのようなものでもありません。詳しくは利用規約をご覧ください。
オープンソーススクリプト
TradingViewの精神に則り、この作者はスクリプトのソースコードを公開しているので、その内容を理解し検証することができます。作者に感謝です!無料でお使いいただけますが、このコードを投稿に再利用する際にはハウスルールに従うものとします。
免責事項
これらの情報および投稿は、TradingViewが提供または保証する金融、投資、取引、またはその他の種類のアドバイスや推奨を意図したものではなく、またそのようなものでもありません。詳しくは利用規約をご覧ください。