OPEN-SOURCE SCRIPT
IU Trade Management
DESCRIPTION
IU Trade Management is a powerful utility tool designed to help traders manage their trades with precision and clarity. It provides automated Stop Loss, Take Profit, and Break Even calculations using multiple customizable methods. Along with clear SL/TP plotting on the chart, it also displays a detailed trade status table that tracks every important detail including entry price, SL/TP levels, break-even, PNL, and trade duration. This tool is perfect for traders who want to manage risk and rewards visually and systematically.
USER INPUTS :
-Entry Candle Time: Default 20 Jul 2021 00:00 +0300 (select the candle from which the trade begins)
- Entry Price: Default 2333 (define the price at which the trade is executed)
- Trade Direction: Default Long (choose between Long or Short)
- SL/TP Method: Default ATR (options: ATR, Points/Pips, Percentage %, Standard Deviation, Highest/Lowest, Previous High/Low)
- Risk to Reward: Default 3 (set custom risk-to-reward ratio)
- Use Break Even: Default false (option to enable break-even)
- Plot Break Even Line: Default false (option to display BE line)
- RTR of Break Even Point: Default 2 (factor used for BE calculation)
SL/TP Method Specific Inputs:
- ATR Length: Default 14
- ATR Factor: Default 2
- Points/Pips: Default 100
- Percentage: Default 1%
- Standard Deviation Length: Default 20
- Standard Deviation Factor: Default 2
- Highest/Lowest Length: Default 10
Trade Status Table Settings:
- Show Trade Status: Default true
- Table Size: Default small (options: normal, tiny, small, large)
- Table Position: Default top right
- Frame Width: Default 2
- Table Color: Default black
- Frame Color: Default gray
- Border Width: Default 2
- Border Color: Default gray
- Text Color: Default purple (RGB 212, 0, 255)
HOW TO USE THE INDICATOR:
1. Set the entry candle time and entry price manually.
2. Select whether the trade is Long or Short.
3. Choose the preferred SL/TP calculation method (ATR, Percentage, Points, STD, High/Low, Previous High/Low).
4. Define your risk-to-reward ratio and enable break-even if required.
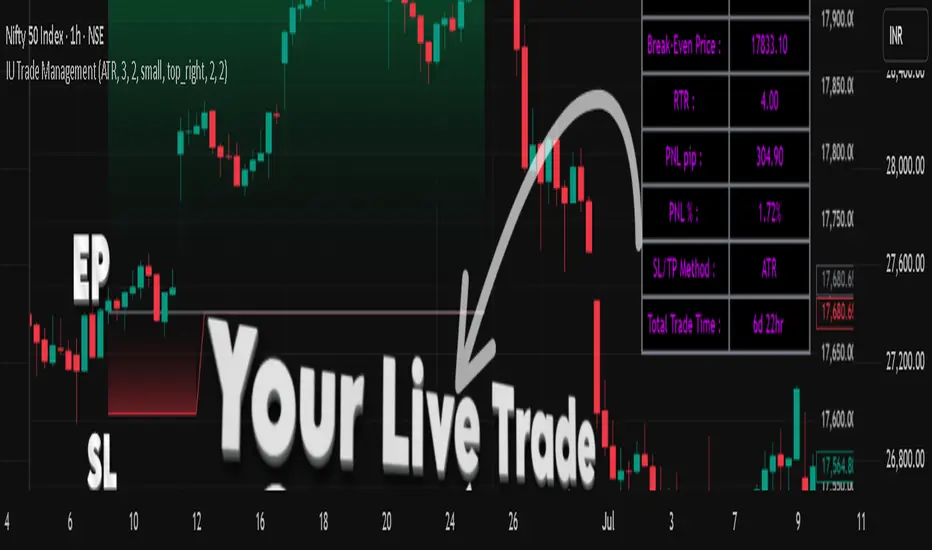
5. The indicator will automatically plot your Entry, Stop Loss, Take Profit, and Break Even levels on the chart.
6. A detailed trade management table will appear, showing trade direction, SL, TP, PNL (points and %), SL/TP method, and total trade time.
WHY IT IS UNIQUE:
- Offers multiple methods to calculate SL and TP (ATR, Percentage, Points, Standard Deviation, High/Low, Previous High/Low)
- Built-in Break Even functionality for risk-free trade management
- Real-time PNL tracking in both points and percentage
- Trade status table for complete transparency on all trade details
- Visual plotting of SL, TP, and Entry with color-coded zones for clarity
HOW USER CAN BENEFIT FROM IT :
- Helps traders manage risk and reward with discipline
- Eliminates guesswork by automating SL and TP levels
- Provides clear visual guidance on trade exits and risk management
- Enhances decision-making with live trade tracking and performance statistics
- Suitable for manual traders as a trade manager and for strategy developers as a risk management reference
IU Trade Management is a powerful utility tool designed to help traders manage their trades with precision and clarity. It provides automated Stop Loss, Take Profit, and Break Even calculations using multiple customizable methods. Along with clear SL/TP plotting on the chart, it also displays a detailed trade status table that tracks every important detail including entry price, SL/TP levels, break-even, PNL, and trade duration. This tool is perfect for traders who want to manage risk and rewards visually and systematically.
USER INPUTS :
-Entry Candle Time: Default 20 Jul 2021 00:00 +0300 (select the candle from which the trade begins)
- Entry Price: Default 2333 (define the price at which the trade is executed)
- Trade Direction: Default Long (choose between Long or Short)
- SL/TP Method: Default ATR (options: ATR, Points/Pips, Percentage %, Standard Deviation, Highest/Lowest, Previous High/Low)
- Risk to Reward: Default 3 (set custom risk-to-reward ratio)
- Use Break Even: Default false (option to enable break-even)
- Plot Break Even Line: Default false (option to display BE line)
- RTR of Break Even Point: Default 2 (factor used for BE calculation)
SL/TP Method Specific Inputs:
- ATR Length: Default 14
- ATR Factor: Default 2
- Points/Pips: Default 100
- Percentage: Default 1%
- Standard Deviation Length: Default 20
- Standard Deviation Factor: Default 2
- Highest/Lowest Length: Default 10
Trade Status Table Settings:
- Show Trade Status: Default true
- Table Size: Default small (options: normal, tiny, small, large)
- Table Position: Default top right
- Frame Width: Default 2
- Table Color: Default black
- Frame Color: Default gray
- Border Width: Default 2
- Border Color: Default gray
- Text Color: Default purple (RGB 212, 0, 255)
HOW TO USE THE INDICATOR:
1. Set the entry candle time and entry price manually.
2. Select whether the trade is Long or Short.
3. Choose the preferred SL/TP calculation method (ATR, Percentage, Points, STD, High/Low, Previous High/Low).
4. Define your risk-to-reward ratio and enable break-even if required.
5. The indicator will automatically plot your Entry, Stop Loss, Take Profit, and Break Even levels on the chart.
6. A detailed trade management table will appear, showing trade direction, SL, TP, PNL (points and %), SL/TP method, and total trade time.
WHY IT IS UNIQUE:
- Offers multiple methods to calculate SL and TP (ATR, Percentage, Points, Standard Deviation, High/Low, Previous High/Low)
- Built-in Break Even functionality for risk-free trade management
- Real-time PNL tracking in both points and percentage
- Trade status table for complete transparency on all trade details
- Visual plotting of SL, TP, and Entry with color-coded zones for clarity
HOW USER CAN BENEFIT FROM IT :
- Helps traders manage risk and reward with discipline
- Eliminates guesswork by automating SL and TP levels
- Provides clear visual guidance on trade exits and risk management
- Enhances decision-making with live trade tracking and performance statistics
- Suitable for manual traders as a trade manager and for strategy developers as a risk management reference
オープンソーススクリプト
TradingViewの精神に則り、このスクリプトの作者はコードをオープンソースとして公開してくれました。トレーダーが内容を確認・検証できるようにという配慮です。作者に拍手を送りましょう!無料で利用できますが、コードの再公開はハウスルールに従う必要があります。
Shivam mandai
免責事項
この情報および投稿は、TradingViewが提供または推奨する金融、投資、トレード、その他のアドバイスや推奨を意図するものではなく、それらを構成するものでもありません。詳細は利用規約をご覧ください。
オープンソーススクリプト
TradingViewの精神に則り、このスクリプトの作者はコードをオープンソースとして公開してくれました。トレーダーが内容を確認・検証できるようにという配慮です。作者に拍手を送りましょう!無料で利用できますが、コードの再公開はハウスルールに従う必要があります。
Shivam mandai
免責事項
この情報および投稿は、TradingViewが提供または推奨する金融、投資、トレード、その他のアドバイスや推奨を意図するものではなく、それらを構成するものでもありません。詳細は利用規約をご覧ください。