OPEN-SOURCE SCRIPT
更新済 S73 RSI & Stoch RSI
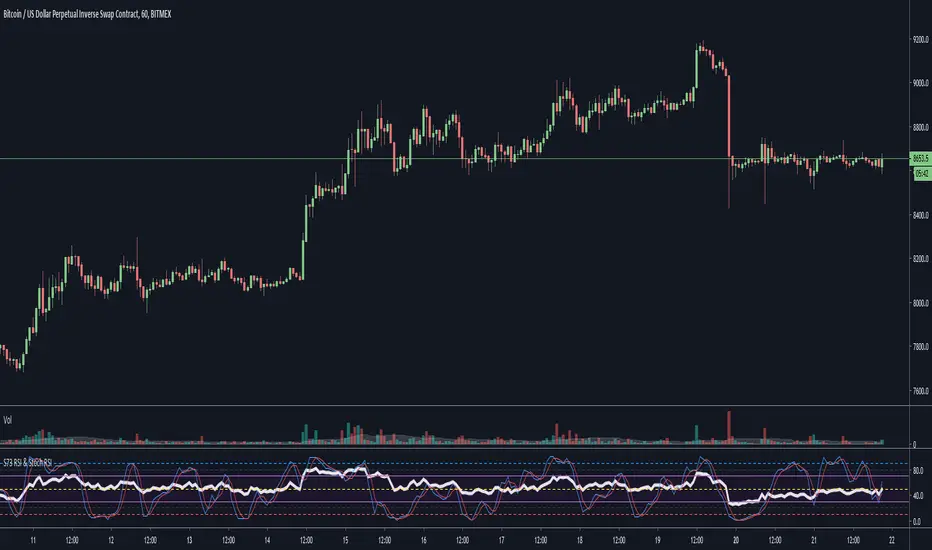
RSI and Stoch RSI combined into 1.
Get 2 for the price of 1.
Stoch RSI has two extra h lines, 10 an 90, as well as the traditional 20 and 80.
Remember, High Stoch RSI can mark the strength of a trend, doesn't necessarily mean there will be a change in trend once top and bottom levels are hit.
Click here to see how BTC has been topped out between levels of 90-100 for 14 weeks on the weekly chart.
リリースノート
Added some code for plot description so alerts can be added easily for crosses.オープンソーススクリプト
TradingViewの精神に則り、このスクリプトの作者はコードをオープンソースとして公開してくれました。トレーダーが内容を確認・検証できるようにという配慮です。作者に拍手を送りましょう!無料で利用できますが、コードの再公開はハウスルールに従う必要があります。
免責事項
この情報および投稿は、TradingViewが提供または推奨する金融、投資、トレード、その他のアドバイスや推奨を意図するものではなく、それらを構成するものでもありません。詳細は利用規約をご覧ください。
オープンソーススクリプト
TradingViewの精神に則り、このスクリプトの作者はコードをオープンソースとして公開してくれました。トレーダーが内容を確認・検証できるようにという配慮です。作者に拍手を送りましょう!無料で利用できますが、コードの再公開はハウスルールに従う必要があります。
免責事項
この情報および投稿は、TradingViewが提供または推奨する金融、投資、トレード、その他のアドバイスや推奨を意図するものではなく、それらを構成するものでもありません。詳細は利用規約をご覧ください。