OPEN-SOURCE SCRIPT
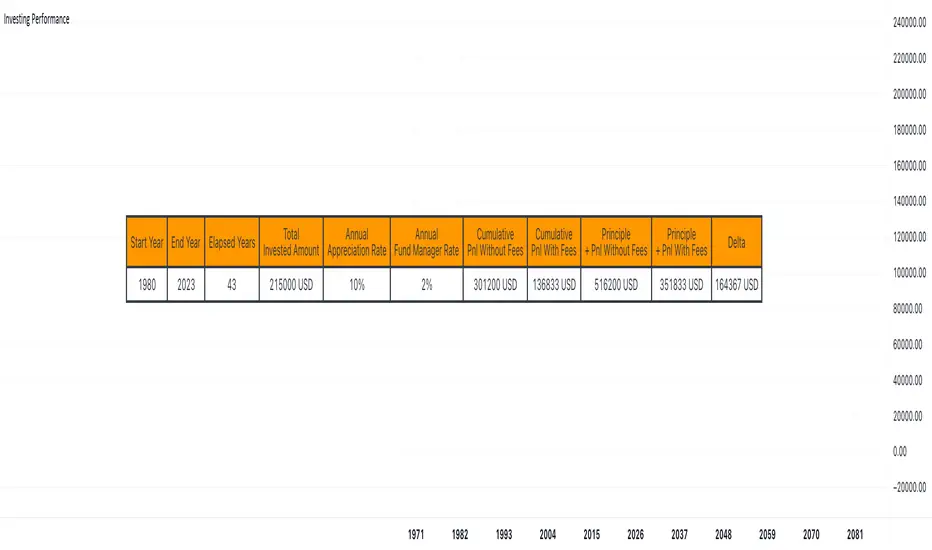
Investing Performance with vs without fees

Hello traders,
I had a chat with a friend recently who's using a fund manager services to invest for him in some US-based ETFs tracking the US indices.
I showed him using an online tool that those 2% annual fees he's paying to his fund manager are eating a lot of his profit overtime.
As I had some time, I decided to code this simulator in Pinescript because .... why not :)
RicardoSantos already did that Compound Interest function (tradingview.com/script/woq6TTda-FunctionCompoundInterest/)
I added the n parameter being the number of times the interest is compounded per unit of time
Compound interest is calculated using the following formula
CI = P*(1 + R/n) (n*t) – P
Here,
For now, the script only works on a yearly chart - I might update it later making it compatible with other chart timeframes - assuming there is some demand for it
If there is, let me know in the comments down below
All the best
Dave
I had a chat with a friend recently who's using a fund manager services to invest for him in some US-based ETFs tracking the US indices.
I showed him using an online tool that those 2% annual fees he's paying to his fund manager are eating a lot of his profit overtime.
As I had some time, I decided to code this simulator in Pinescript because .... why not :)
RicardoSantos already did that Compound Interest function (tradingview.com/script/woq6TTda-FunctionCompoundInterest/)
I added the n parameter being the number of times the interest is compounded per unit of time
Compound interest is calculated using the following formula
CI = P*(1 + R/n) (n*t) – P
Here,
- P is the principal amount.
- R is the annual interest rate.
- t is the time the money is invested or borrowed for.
- n is the number of times that interest is compounded per unit t, for example if interest is compounded monthly and t is in years then the value of n would be 12.
If interest is compounded quarterly and t is in years then the value of n would be 4.
For now, the script only works on a yearly chart - I might update it later making it compatible with other chart timeframes - assuming there is some demand for it
If there is, let me know in the comments down below
All the best
Dave
オープンソーススクリプト
TradingViewの精神に則り、このスクリプトの作者はコードをオープンソースとして公開してくれました。トレーダーが内容を確認・検証できるようにという配慮です。作者に拍手を送りましょう!無料で利用できますが、コードの再公開はハウスルールに従う必要があります。
⭐️ I'm looking to sell Best Trading Indicator. DM me if interested
⭐️ Listed as an Official TradingView Trusted TOP Pine Programmer
📧 Coding/Consulting Inquiries: dave@best-trading-indicator.com
⏩ Course: best-trading-indicator.com
⭐️ Listed as an Official TradingView Trusted TOP Pine Programmer
📧 Coding/Consulting Inquiries: dave@best-trading-indicator.com
⏩ Course: best-trading-indicator.com
免責事項
この情報および投稿は、TradingViewが提供または推奨する金融、投資、トレード、その他のアドバイスや推奨を意図するものではなく、それらを構成するものでもありません。詳細は利用規約をご覧ください。