OPEN-SOURCE SCRIPT
Linear Regression with StdDev Bands
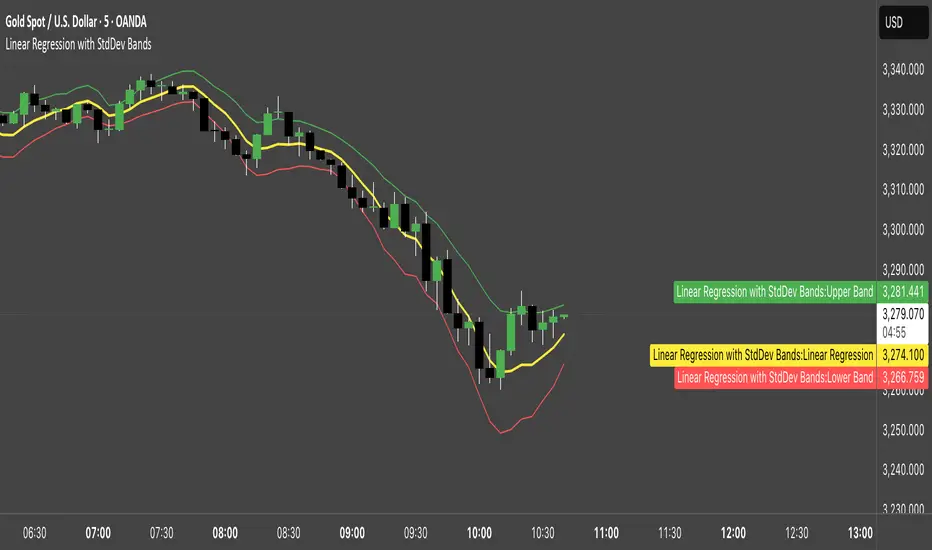
Linear Regression with Standard Deviation Bands Indicator
This indicator plots a linear regression line along with upper and lower bands based on standard deviation. It helps identify potential overbought and oversold conditions, as well as trend direction and strength.
Key Components:
Linear Regression Line: Represents the average price over a specified period.
Upper and Lower Bands: Calculated by adding and subtracting the standard deviation (multiplied by a user-defined factor) from the linear regression line. These bands act as dynamic support and resistance levels.
How to Use:
Trend Identification: The direction of the linear regression line indicates the prevailing trend.
Overbought/Oversold Signals: Prices approaching or crossing the upper band may suggest overbought conditions, while prices near the lower band may indicate oversold conditions.
Dynamic Support/Resistance: The bands can act as potential support and resistance levels.
Alerts: Option to enable alerts when the price crosses above the upper band or below the lower band.
Customization:
Regression Length: Adjust the period over which the linear regression is calculated.
StdDev Multiplier: Modify the width of the bands by changing the standard deviation multiplier.
Price Source: Choose which price data to use for calculations (e.g., close, open, high, low).
Alerts: Enable or disable alerts for band crossings.
This indicator is a versatile tool for understanding price trends and potential reversal points.
オープンソーススクリプト
TradingViewの精神に則り、このスクリプトの作者はコードをオープンソースとして公開してくれました。トレーダーが内容を確認・検証できるようにという配慮です。作者に拍手を送りましょう!無料で利用できますが、コードの再公開はハウスルールに従う必要があります。
免責事項
この情報および投稿は、TradingViewが提供または推奨する金融、投資、トレード、その他のアドバイスや推奨を意図するものではなく、それらを構成するものでもありません。詳細は利用規約をご覧ください。
オープンソーススクリプト
TradingViewの精神に則り、このスクリプトの作者はコードをオープンソースとして公開してくれました。トレーダーが内容を確認・検証できるようにという配慮です。作者に拍手を送りましょう!無料で利用できますが、コードの再公開はハウスルールに従う必要があります。
免責事項
この情報および投稿は、TradingViewが提供または推奨する金融、投資、トレード、その他のアドバイスや推奨を意図するものではなく、それらを構成するものでもありません。詳細は利用規約をご覧ください。