OPEN-SOURCE SCRIPT
PROWIN STUDY BITCOIN DOMINANCE CYCLE

**Title: PROWIN STUDY BITCOIN DOMINANCE CYCLE**
**Overview:**
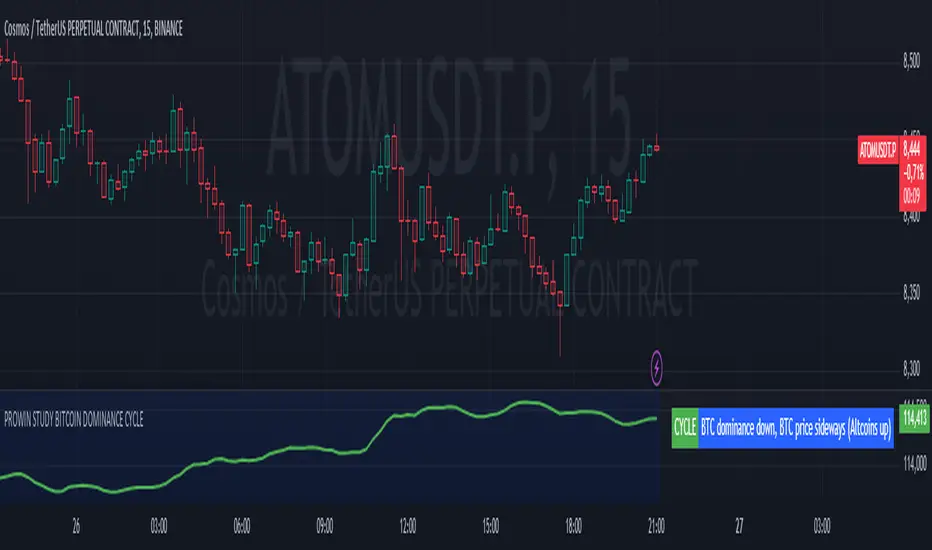
This TradingView script analyzes the relationship between Bitcoin dominance and Bitcoin price movements, as well as the performance of altcoins. It categorizes market conditions into different scenarios based on the movements of Bitcoin dominance and Bitcoin price, and plots the Exponential Moving Average (EMA) of the altcoins index.
**Key Components:**
1. **Bitcoin Dominance:**
- `dominanceBTC`: Fetches the Bitcoin dominance from the "CRYPTOCAP:BTC.D" symbol for the current timeframe.
2. **Bitcoin Price:**
- `priceBTC`: Uses the closing price of Bitcoin from the current chart (assumed to be BTC/USD).
3. **Altcoins Index:**
- `altcoinsIndex`: Fetches the total market cap of altcoins (excluding Bitcoin) from the "CRYPTOCAP:TOTAL2" symbol.
4. **EMA of Altcoins:**
- `emaAltcoins`: Calculates the 20-period Exponential Moving Average (EMA) of the altcoins index.
**Conditions:**
1. **Bitcoin Dominance and Price Up:**
- `dominanceBTC_up`: Bitcoin dominance crosses above its 20-period Simple Moving Average (SMA).
- `priceBTC_up`: Bitcoin price crosses above its 20-period SMA.
2. **Bitcoin Dominance Up and Price Down:**
- `priceBTC_down`: Bitcoin price crosses below its 20-period SMA.
3. **Bitcoin Dominance Up and Price Sideways:**
- `priceBTC_lateral`: Bitcoin price change is less than 5% of its 10-period average change.
4. **Altseason:**
- `altseason_condition`: Bitcoin dominance crosses below its 20-period SMA while Bitcoin price crosses above its 20-period SMA.
5. **Dump:**
- `dump_altcoins_condition`: Bitcoin dominance crosses below its 20-period SMA while Bitcoin price crosses below its 20-period SMA.
6. **Altcoins Up:**
- `altcoins_up_condition`: Bitcoin dominance crosses below its 20-period SMA while Bitcoin price moves sideways.
**Current Condition:**
- Determines the current market condition based on the above scenarios and stores it in the `currentCondition` variable.
**Plotting:**
- Plots the EMA of the altcoins index on the chart in green with a linewidth of 2.
- Displays the current market condition in a table at the top-right of the chart, with appropriate background and text colors.
**Background Color:**
- Sets a semi-transparent blue background color for the chart.
This script helps traders visualize and understand the market dynamics between Bitcoin dominance, Bitcoin price, and altcoin performance, providing insights into different market cycles and potential trading opportunities.
オープンソーススクリプト
TradingViewの精神に則り、このスクリプトの作者はコードをオープンソースとして公開してくれました。トレーダーが内容を確認・検証できるようにという配慮です。作者に拍手を送りましょう!無料で利用できますが、コードの再公開はハウスルールに従う必要があります。
免責事項
この情報および投稿は、TradingViewが提供または推奨する金融、投資、トレード、その他のアドバイスや推奨を意図するものではなく、それらを構成するものでもありません。詳細は利用規約をご覧ください。
オープンソーススクリプト
TradingViewの精神に則り、このスクリプトの作者はコードをオープンソースとして公開してくれました。トレーダーが内容を確認・検証できるようにという配慮です。作者に拍手を送りましょう!無料で利用できますが、コードの再公開はハウスルールに従う必要があります。
免責事項
この情報および投稿は、TradingViewが提供または推奨する金融、投資、トレード、その他のアドバイスや推奨を意図するものではなく、それらを構成するものでもありません。詳細は利用規約をご覧ください。