OPEN-SOURCE SCRIPT
Stock Performance Dashboard + Sector Performance
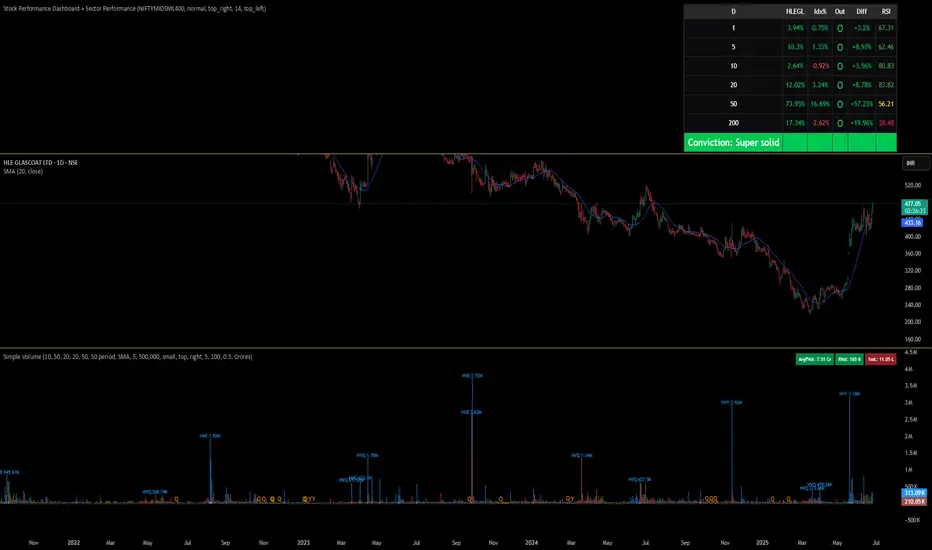
This indicator, Stock Performance Dashboard + Sector Performance, provides a comprehensive visual analysis of both individual stock performance and sectoral trends directly on your TradingView chart.
Key Features:
Performance Dashboard Table:
Displays the stock’s returns over multiple timeframes (1, 5, 10, 20, 50, 200 days) and compares them to a selected benchmark index (default: NIFTYMIDSML400).
Highlights whether the stock is outperforming the index for each period, shows the difference in performance, and includes an RSI (Relative Strength Index) column for additional momentum insight.
Calculates and displays a “conviction” score and level based on how often the stock outperforms the index across periods.
Sector Performance Table:
Ranks and displays the top-performing sectors from a predefined list of major NSE sector indices over four key periods (1D, 5D, 30D, 50D).
For each period, the top 5 sectors are shown, with color-coded performance for quick visual assessment.
Customization:
Includes options for dark/light mode, table size, position, and which columns to display.
Supports a compact “mini mode” for simplified visualization.
Usage:
This tool is ideal for traders and investors who want a quick, at-a-glance comparison of a stock’s short- and long-term momentum versus its benchmark, as well as a live snapshot of sector rotation and leadership in the Indian market. All data is presented in clear, color-coded tables for actionable decision-making.
オープンソーススクリプト
TradingViewの精神に則り、このスクリプトの作者はコードをオープンソースとして公開してくれました。トレーダーが内容を確認・検証できるようにという配慮です。作者に拍手を送りましょう!無料で利用できますが、コードの再公開はハウスルールに従う必要があります。
免責事項
この情報および投稿は、TradingViewが提供または推奨する金融、投資、トレード、その他のアドバイスや推奨を意図するものではなく、それらを構成するものでもありません。詳細は利用規約をご覧ください。
オープンソーススクリプト
TradingViewの精神に則り、このスクリプトの作者はコードをオープンソースとして公開してくれました。トレーダーが内容を確認・検証できるようにという配慮です。作者に拍手を送りましょう!無料で利用できますが、コードの再公開はハウスルールに従う必要があります。
免責事項
この情報および投稿は、TradingViewが提供または推奨する金融、投資、トレード、その他のアドバイスや推奨を意図するものではなく、それらを構成するものでもありません。詳細は利用規約をご覧ください。