OPEN-SOURCE SCRIPT
更新済 Price Iterations with Pips
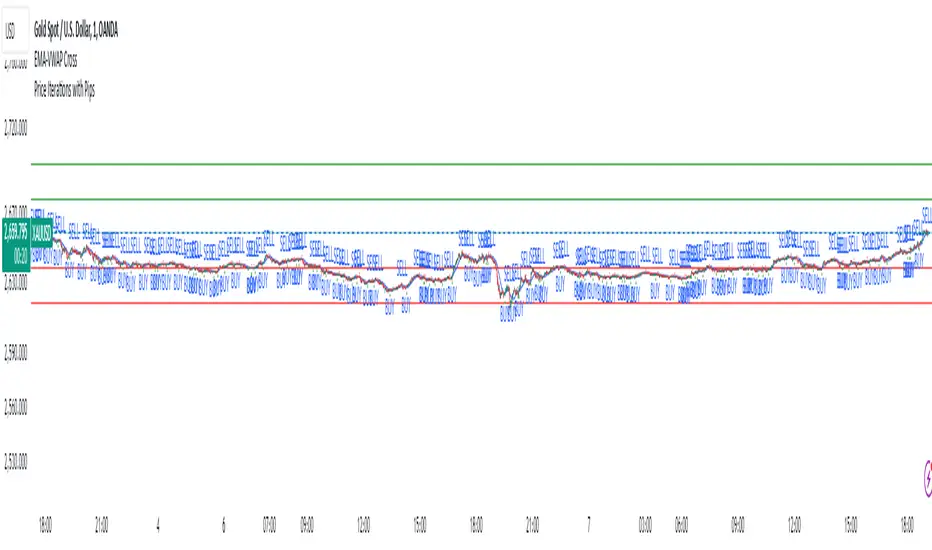
*Script Name:* Price Iterations with Pips
*Description:* This script plots horizontal lines above and below a user-defined initial price, representing price iterations based on a specified number of pips.
*Functionality:*
1. Asks for user input:
- Initial Price
- Pips per Iteration
- Number of Iterations
2. Calculates the price change per pip.
3. Plots horizontal lines:
- Above the initial price (green)
- Below the initial price (red)
4. Extends lines dynamically to both sides.
*Use Cases:*
1. *Support and Resistance Levels:* Use the script to visualize potential support and resistance levels based on price iterations.
2. *Price Targets:* Set the initial price as a target and use the iterations to estimate potential profit/loss levels.
3. *Risk Management:* Utilize the script to visualize risk levels based on pip iterations.
4. *Technical Analysis:* Combine the script with other technical indicators to identify potential trading opportunities.
*Trading Platforms:* This script is designed for TradingView.
*How to Use:*
1. Add the script to your TradingView chart.
2. Set the initial price, pips per iteration, and number of iterations.
3. Adjust the colors and line styles as needed.
4. Zoom in/out and pan to see the lines adjust.
*Benefits:*
1. Visualize price iterations and potential support/resistance levels.
2. Simplify risk management and price target estimation.
3. Enhance technical analysis with customizable price levels.
リリースノート
I have updated the Multiplier value,Users have to Insert the current price of the Instrument and experiment with the Multiplier value and Pips per Iteration to mark the Equidistant levels from the given Initial value.
リリースノート
Corrected the Mistakes in codeオープンソーススクリプト
TradingViewの精神に則り、このスクリプトの作者はコードをオープンソースとして公開してくれました。トレーダーが内容を確認・検証できるようにという配慮です。作者に拍手を送りましょう!無料で利用できますが、コードの再公開はハウスルールに従う必要があります。
免責事項
この情報および投稿は、TradingViewが提供または推奨する金融、投資、トレード、その他のアドバイスや推奨を意図するものではなく、それらを構成するものでもありません。詳細は利用規約をご覧ください。
オープンソーススクリプト
TradingViewの精神に則り、このスクリプトの作者はコードをオープンソースとして公開してくれました。トレーダーが内容を確認・検証できるようにという配慮です。作者に拍手を送りましょう!無料で利用できますが、コードの再公開はハウスルールに従う必要があります。
免責事項
この情報および投稿は、TradingViewが提供または推奨する金融、投資、トレード、その他のアドバイスや推奨を意図するものではなく、それらを構成するものでもありません。詳細は利用規約をご覧ください。