PROTECTED SOURCE SCRIPT
RM - Inverse Fisher Transform RSI

RM - Inverse Fisher Transform RSI (RM - IFTR)
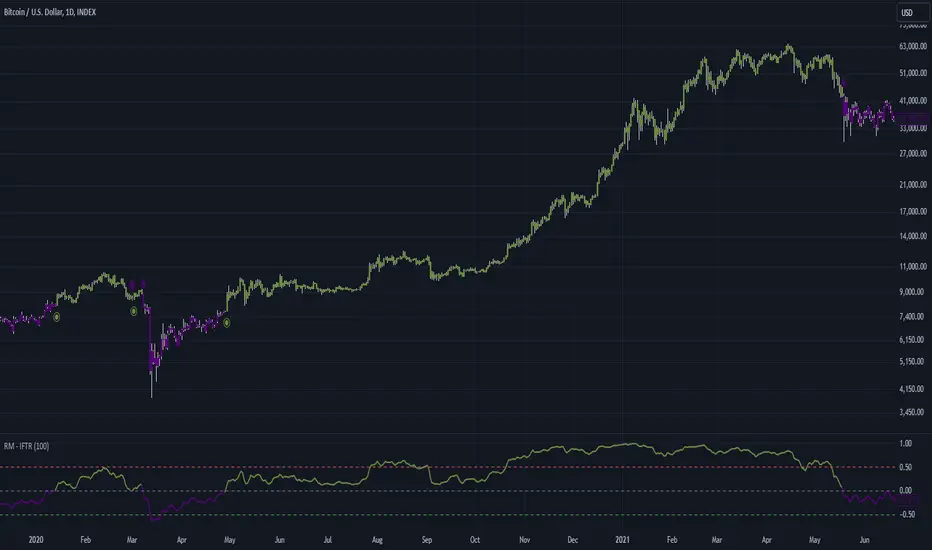
This indicator combines the Relative Strength Index (RSI) with the Inverse Fisher Transform (IFT) to enhance market trend identification. It uses multiple RSI calculations on price data (high, low, open, close) and applies the IFT for smoother, more reliable signals.
Key Features
- Inverse Fisher Transform: The RSI values are transformed using the IFT, which amplifies extreme values and improves the detection of trend reversals.
- Multiple RSI Calculations: The indicator calculates RSI based on the high, low, open, and close prices, providing a broader view of market momentum.
- Smoothed Output: A weighted moving average (WMA) is applied to the transformed RSI values, reducing noise and enhancing trend clarity.
- Dynamic Bar Coloring: Bars are color-coded to reflect market conditions:
- Green for bullish conditions (sum > 0).
- Purple for bearish conditions (sum < 0).
- Crossover Signals: Small dots appear above or below the bars when the indicator crosses the 0 line, signaling potential entry points:
- Long (⦿ below bars) when the value crosses above 0.
- Short (⦿ above bars) when the value crosses below 0.
- Alert Conditions: Built-in alerts notify traders when the indicator crosses above or below 0, indicating long or short market conditions.
How It Works
- The indicator calculates RSI for four different price components (high, low, open, close) over a specified period.
- The Inverse Fisher Transform is applied to each RSI value, enhancing extreme market conditions.
- A weighted moving average (WMA) is used to smooth the transformed RSI values, providing clearer signals.
- The resulting value is plotted as a line, with color-coded bars indicating bullish or bearish trends.
How to Use
- Identify Market Direction: Look for green bars to indicate bullish conditions and purple bars for bearish conditions.
- Spot Entry Signals: Use the crossover points (dots) when the indicator crosses above or below 0 to spot potential long or short opportunities.
- Confirm Trends: Combine the indicator with other trend-following tools to confirm market movements and reduce noise.
Example Use Cases
- Trend Following: Use the color-coded bars and crossover signals to enter trades that align with the prevailing market direction.
- Reversal Confirmation: Look for crossovers near the 0 level to identify potential trend reversals.
Disclaimer
This indicator is a tool for enhancing trend detection and market momentum analysis. It should not be used in isolation and must be combined with proper risk management and additional indicators for comprehensive market analysis.
保護スクリプト
このスクリプトのソースコードは非公開で投稿されています。 ただし、制限なく自由に使用できます – 詳細はこちらでご確認ください。
免責事項
この情報および投稿は、TradingViewが提供または推奨する金融、投資、トレード、その他のアドバイスや推奨を意図するものではなく、それらを構成するものでもありません。詳細は利用規約をご覧ください。
保護スクリプト
このスクリプトのソースコードは非公開で投稿されています。 ただし、制限なく自由に使用できます – 詳細はこちらでご確認ください。
免責事項
この情報および投稿は、TradingViewが提供または推奨する金融、投資、トレード、その他のアドバイスや推奨を意図するものではなく、それらを構成するものでもありません。詳細は利用規約をご覧ください。