OPEN-SOURCE SCRIPT
Combined Stock Session Percent Change Monitor
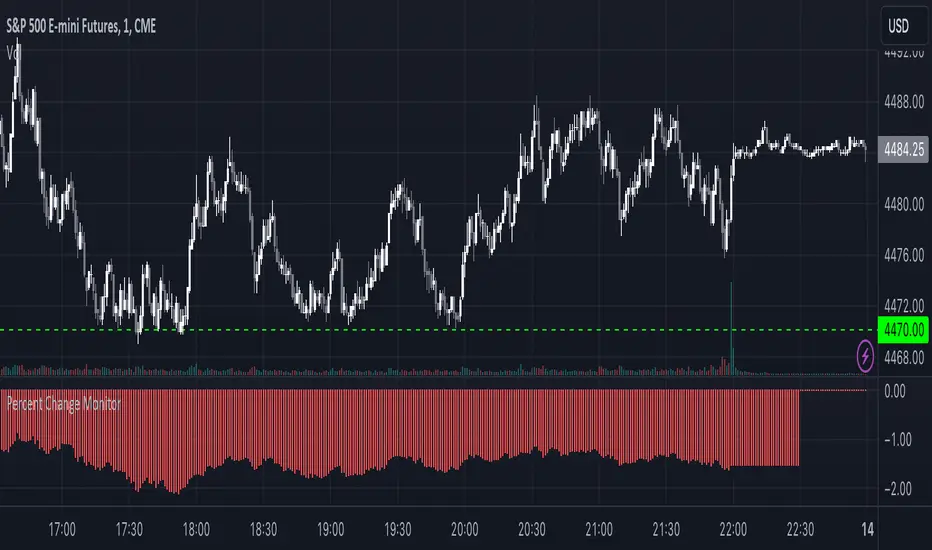
Introducing the "Combined Stock Session Percent Change Monitor" - a unique tool tailored for traders who wish to track the collective performance of up to five stocks in real-time during a trading session.
Key Features:
User Customization: Easily input and monitor any five stock symbols of your choice. By default, the script tracks "AAPL", "MSFT", "AMZN", "TSLA", and "NVDA".
Session-Based Tracking: The script captures and calculates the percentage change from the start of a trading session, set at 15:30. This allows traders to gauge intraday performance.
Visual Clarity: The combined percentage change is plotted as columns, with green indicating a positive change and red indicating a negative change. This provides a clear, visual representation of the stocks' collective performance.
Versatility: Whether you're tracking the performance of stocks in a specific sector, or you're keeping an eye on your personal portfolio's top holdings, this tool offers a concise view of collective stock movement.
Usage:
Simply input the desired stock symbols and let the script do the rest. The plotted columns will provide a quick snapshot of how these stocks are performing collectively since the session's start.
Conclusion:
Stay ahead of the market by monitoring the combined performance of your chosen stocks. Whether you're an intraday trader or a long-term investor, this tool offers valuable insights into collective stock behavior. Happy trading!
(Note: Always conduct your own research and due diligence before making any trading decisions. This tool is meant to aid in analysis and not to serve as financial advice.)
オープンソーススクリプト
TradingViewの精神に則り、このスクリプトの作者はコードをオープンソースとして公開してくれました。トレーダーが内容を確認・検証できるようにという配慮です。作者に拍手を送りましょう!無料で利用できますが、コードの再公開はハウスルールに従う必要があります。
免責事項
この情報および投稿は、TradingViewが提供または推奨する金融、投資、トレード、その他のアドバイスや推奨を意図するものではなく、それらを構成するものでもありません。詳細は利用規約をご覧ください。
オープンソーススクリプト
TradingViewの精神に則り、このスクリプトの作者はコードをオープンソースとして公開してくれました。トレーダーが内容を確認・検証できるようにという配慮です。作者に拍手を送りましょう!無料で利用できますが、コードの再公開はハウスルールに従う必要があります。
免責事項
この情報および投稿は、TradingViewが提供または推奨する金融、投資、トレード、その他のアドバイスや推奨を意図するものではなく、それらを構成するものでもありません。詳細は利用規約をご覧ください。