OPEN-SOURCE SCRIPT
更新済 ADX+ Oscillator
📈 ADX+ Oscillator — Enhanced Trend Strength Indicator
🔹 Description:
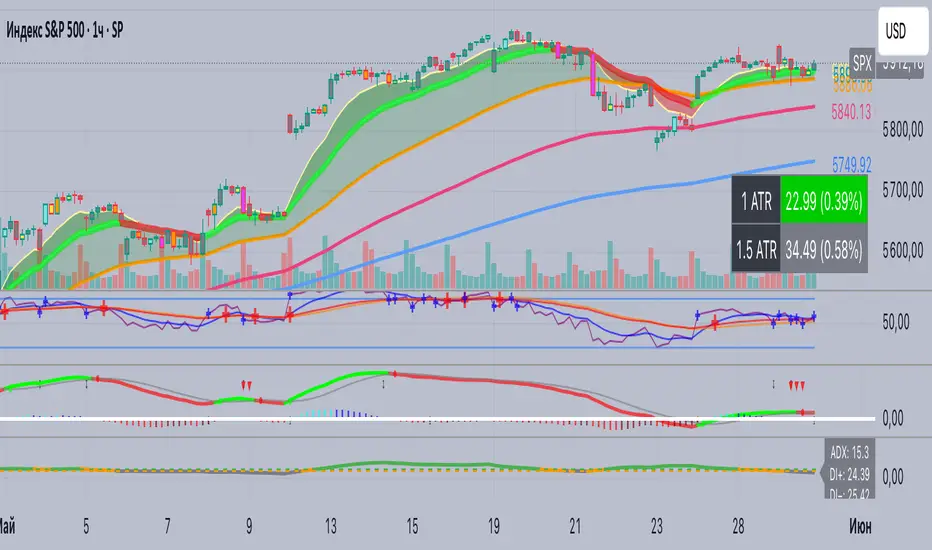
A modified oscillator based on the ADX (Average Directional Index), providing both visual and digital interpretation of trend strength and direction. A powerful tool for filtering sideways markets and identifying strong impulses across any timeframe.
🔹 Features:
• ADX line to assess trend strength
• DI+ and DI− lines to determine trend direction
• Colored background zones:
• Gray: ranging market (ADX < 20)
• Orange: transition zone (20 ≤ ADX < 25)
• Green: strong trend (ADX ≥ 25)
• Digital value labels for ADX / DI+ / DI− on the latest candle
• Signal arrows when DI+ crosses DI− and vice versa
🔹 Why use it:
• Signal filtering: avoid trades in flat markets (ADX < 20)
• Trend confirmation: enter only when ADX is rising above 25
• Directional guidance via DI+ and DI− behavior
🔹 Best for:
• Scalping (1m, 5m)
• Intraday trading (15m, 1h)
• Swing trading (4h and above)
• Breakout and pullback strategies
🔹 Description:
A modified oscillator based on the ADX (Average Directional Index), providing both visual and digital interpretation of trend strength and direction. A powerful tool for filtering sideways markets and identifying strong impulses across any timeframe.
🔹 Features:
• ADX line to assess trend strength
• DI+ and DI− lines to determine trend direction
• Colored background zones:
• Gray: ranging market (ADX < 20)
• Orange: transition zone (20 ≤ ADX < 25)
• Green: strong trend (ADX ≥ 25)
• Digital value labels for ADX / DI+ / DI− on the latest candle
• Signal arrows when DI+ crosses DI− and vice versa
🔹 Why use it:
• Signal filtering: avoid trades in flat markets (ADX < 20)
• Trend confirmation: enter only when ADX is rising above 25
• Directional guidance via DI+ and DI− behavior
🔹 Best for:
• Scalping (1m, 5m)
• Intraday trading (15m, 1h)
• Swing trading (4h and above)
• Breakout and pullback strategies
リリースノート
📈 ADX+ Oscillator — Enhanced Trend Strength Indicator🔹 Description:
A modified oscillator based on the ADX (Average Directional Index), providing both visual and digital interpretation of trend strength and direction. A powerful tool for filtering sideways markets and identifying strong impulses across any timeframe.
🔹 Features:
• ADX line to assess trend strength
• DI+ and DI− lines to determine trend direction
• Colored background zones:
• Gray: ranging market (ADX < 20)
• Orange: transition zone (20 ≤ ADX < 25)
• Green: strong trend (ADX ≥ 25)
• Digital value labels for ADX / DI+ / DI− on the latest candle
• Signal arrows when DI+ crosses DI− and vice versa
🔹 Why use it:
• Signal filtering: avoid trades in flat markets (ADX < 20)
• Trend confirmation: enter only when ADX is rising above 25
• Directional guidance via DI+ and DI− behavior
🔹 Best for:
• Scalping (1m, 5m)
• Intraday trading (15m, 1h)
• Swing trading (4h and above)
• Breakout and pullback strategies
オープンソーススクリプト
TradingViewの精神に則り、このスクリプトの作者はコードをオープンソースとして公開してくれました。トレーダーが内容を確認・検証できるようにという配慮です。作者に拍手を送りましょう!無料で利用できますが、コードの再公開はハウスルールに従う必要があります。
免責事項
この情報および投稿は、TradingViewが提供または推奨する金融、投資、トレード、その他のアドバイスや推奨を意図するものではなく、それらを構成するものでもありません。詳細は利用規約をご覧ください。
オープンソーススクリプト
TradingViewの精神に則り、このスクリプトの作者はコードをオープンソースとして公開してくれました。トレーダーが内容を確認・検証できるようにという配慮です。作者に拍手を送りましょう!無料で利用できますが、コードの再公開はハウスルールに従う必要があります。
免責事項
この情報および投稿は、TradingViewが提供または推奨する金融、投資、トレード、その他のアドバイスや推奨を意図するものではなく、それらを構成するものでもありません。詳細は利用規約をご覧ください。