OPEN-SOURCE SCRIPT
FXS
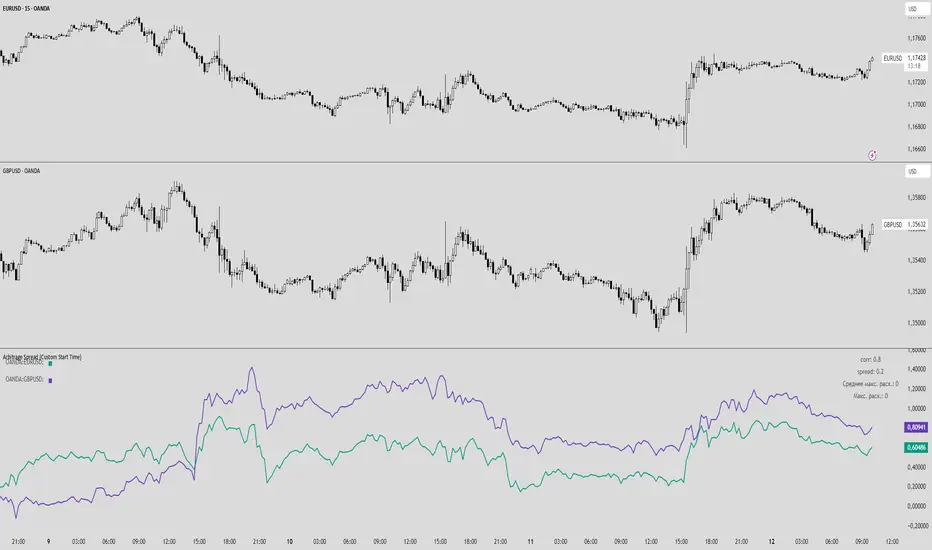
Arbitrage Spread (Custom Start Time)
This indicator analyzes the spread and correlation between two selected instruments or currency pairs.
Key Features:
Displays the percentage change of the two instruments in a separate chart (does not overlay the main chart).
Lines show the entire historical price movement of the selected instruments.
Calculates the current spread and correlation from a chosen date and time (default — last Monday 00:00).
Spread and corr values are rounded to two decimal places for convenience.
The top-right table displays:
corr — correlation coefficient between the instruments,
spread — current spread between the pairs,
Average max deviation for the period — manual input,
Maximum deviation for the entire period — manual input.
The top-left table shows the color of each pair for clarity.
Alerts can be set for specific corr and spread values.
Features:
Historical lines allow visual tracking of dynamics over the entire available period.
Current spread is calculated separately from the selected start time, allowing analysis of current conditions without affecting historical visualization.
Fully customizable: line colors, calculation period, start date/time for spread, manual statistical data.
オープンソーススクリプト
TradingViewの精神に則り、このスクリプトの作者はコードをオープンソースとして公開してくれました。トレーダーが内容を確認・検証できるようにという配慮です。作者に拍手を送りましょう!無料で利用できますが、コードの再公開はハウスルールに従う必要があります。
免責事項
この情報および投稿は、TradingViewが提供または推奨する金融、投資、トレード、その他のアドバイスや推奨を意図するものではなく、それらを構成するものでもありません。詳細は利用規約をご覧ください。
オープンソーススクリプト
TradingViewの精神に則り、このスクリプトの作者はコードをオープンソースとして公開してくれました。トレーダーが内容を確認・検証できるようにという配慮です。作者に拍手を送りましょう!無料で利用できますが、コードの再公開はハウスルールに従う必要があります。
免責事項
この情報および投稿は、TradingViewが提供または推奨する金融、投資、トレード、その他のアドバイスや推奨を意図するものではなく、それらを構成するものでもありません。詳細は利用規約をご覧ください。