OPEN-SOURCE SCRIPT
Mark Earnings Day
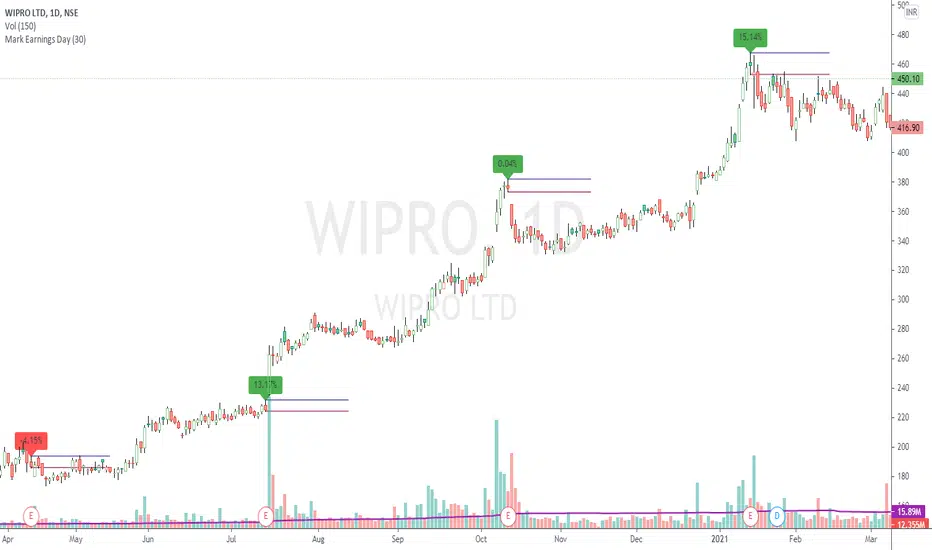
The idea for today is to plot high / low prices on the Earnings day. (use only on Daily timeframe)
And as we all know, most of the times, price is unidirectional after the earnings are declared.
A target of 1:2 or even 1:5 can be easily achieved in these cases, within few days.
Green label indicates, reported earnings are higher than estimated. Red indicates the other way.
But 1, this does not necessarily indicate the trend direction.
But 2, a breakout / breakdown of this day's candle mostly does. The other serving as a Stop Loss.
Optionally, the scripts can also plot splits and dividends on the charts.
The difference between this indicator and readily available default markings on the chart is,
these figures are directly available on the chart itself, that saves multiple clicks.
オープンソーススクリプト
TradingViewの精神に則り、このスクリプトの作者はコードをオープンソースとして公開してくれました。トレーダーが内容を確認・検証できるようにという配慮です。作者に拍手を送りましょう!無料で利用できますが、コードの再公開はハウスルールに従う必要があります。
免責事項
この情報および投稿は、TradingViewが提供または推奨する金融、投資、トレード、その他のアドバイスや推奨を意図するものではなく、それらを構成するものでもありません。詳細は利用規約をご覧ください。
オープンソーススクリプト
TradingViewの精神に則り、このスクリプトの作者はコードをオープンソースとして公開してくれました。トレーダーが内容を確認・検証できるようにという配慮です。作者に拍手を送りましょう!無料で利用できますが、コードの再公開はハウスルールに従う必要があります。
免責事項
この情報および投稿は、TradingViewが提供または推奨する金融、投資、トレード、その他のアドバイスや推奨を意図するものではなく、それらを構成するものでもありません。詳細は利用規約をご覧ください。