OPEN-SOURCE SCRIPT
Reductionism candle chart
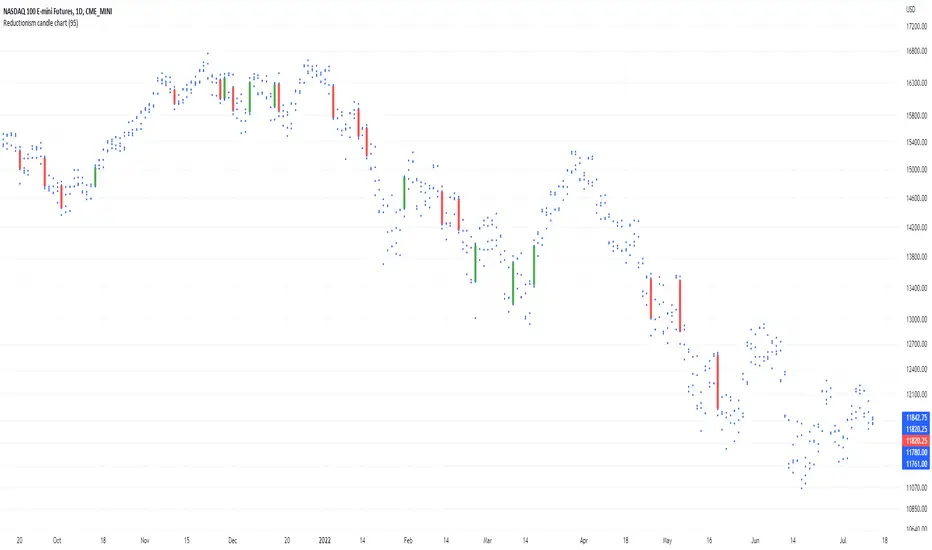
Here I am introducing "Reductionism candle chart", in most of the case takeing away those distracting "candles", and also remaining the most of data (4 dots) for each index on the chart.
And only keeping high valuation change "price gap" filled up with candles.
For someone who don't relies on candles to their decision. Usually candles are redundant to them.
For someone who uses candle, definitely not all candles are carrying the same amount of information.
Most often less is more, in terms of representing the thing that is not related to your model.
This script the color and the volatility boundary are changeable, so no additional coding is required to use it.
Enjoy :)
オープンソーススクリプト
TradingViewの精神に則り、このスクリプトの作者はコードをオープンソースとして公開してくれました。トレーダーが内容を確認・検証できるようにという配慮です。作者に拍手を送りましょう!無料で利用できますが、コードの再公開はハウスルールに従う必要があります。
免責事項
この情報および投稿は、TradingViewが提供または推奨する金融、投資、トレード、その他のアドバイスや推奨を意図するものではなく、それらを構成するものでもありません。詳細は利用規約をご覧ください。
オープンソーススクリプト
TradingViewの精神に則り、このスクリプトの作者はコードをオープンソースとして公開してくれました。トレーダーが内容を確認・検証できるようにという配慮です。作者に拍手を送りましょう!無料で利用できますが、コードの再公開はハウスルールに従う必要があります。
免責事項
この情報および投稿は、TradingViewが提供または推奨する金融、投資、トレード、その他のアドバイスや推奨を意図するものではなく、それらを構成するものでもありません。詳細は利用規約をご覧ください。