OPEN-SOURCE SCRIPT
Point of Control (POC)
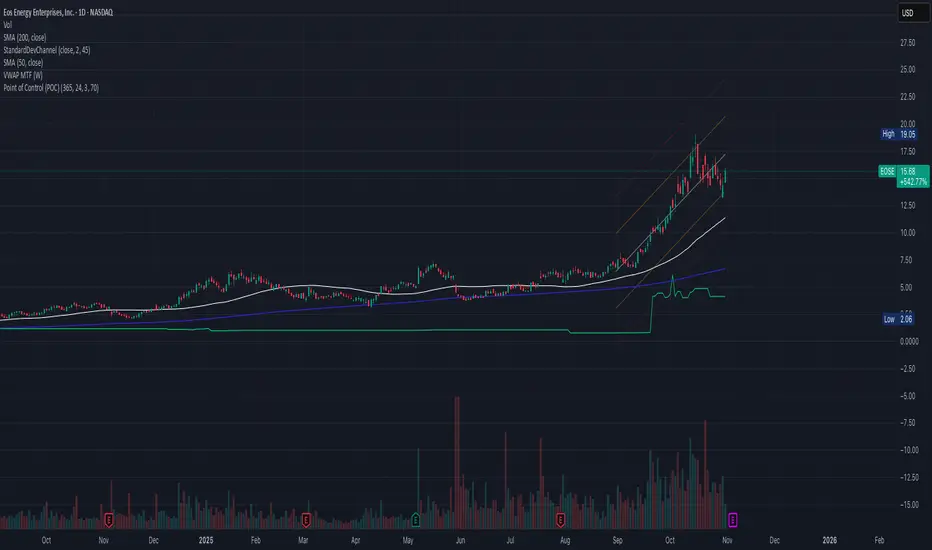
**Point of Control (POC) Indicator**
This indicator identifies the price level where the most trading volume occurred over a specified lookback period (default: 365 days). The POC represents a significant support/resistance level where the market found the most acceptance.
**Key Features:**
- **POC Line**: Bright green horizontal line showing the highest volume price level
- **Volume Profile Analysis**: Divides price range into rows and calculates volume distribution
- **Value Area (Optional)**: Shows VAH and VAL levels containing 70% of total volume
- **Customizable**: Adjust lookback period, price resolution, colors, and line width
**How to Use:**
- POC acts as a magnet - price often returns to test these high-volume levels
- Strong support/resistance zone where significant trading activity occurred
- Useful for identifying key price levels for entries, exits, and stops
- Higher lookback periods (365 days) show longer-term significant levels
**Settings:**
- Lookback Period: Number of bars to analyze (default: 365)
- Price Rows: Calculation resolution - higher = more precise (default: 24)
- Toggle Value Area High/Low for additional context
---
オープンソーススクリプト
TradingViewの精神に則り、このスクリプトの作者はコードをオープンソースとして公開してくれました。トレーダーが内容を確認・検証できるようにという配慮です。作者に拍手を送りましょう!無料で利用できますが、コードの再公開はハウスルールに従う必要があります。
免責事項
この情報および投稿は、TradingViewが提供または推奨する金融、投資、トレード、その他のアドバイスや推奨を意図するものではなく、それらを構成するものでもありません。詳細は利用規約をご覧ください。
オープンソーススクリプト
TradingViewの精神に則り、このスクリプトの作者はコードをオープンソースとして公開してくれました。トレーダーが内容を確認・検証できるようにという配慮です。作者に拍手を送りましょう!無料で利用できますが、コードの再公開はハウスルールに従う必要があります。
免責事項
この情報および投稿は、TradingViewが提供または推奨する金融、投資、トレード、その他のアドバイスや推奨を意図するものではなく、それらを構成するものでもありません。詳細は利用規約をご覧ください。