OPEN-SOURCE SCRIPT
Volume Index (0-100)
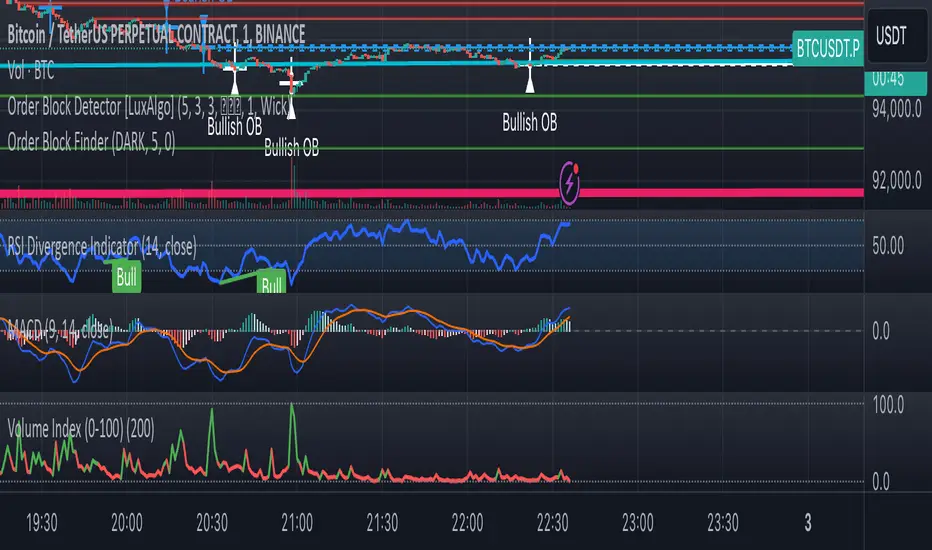
Volume Index (0-100) Indicator
The Volume Index (0-100) indicator is a powerful tool designed to help traders understand current volume levels in relation to past activity over a specified period. By normalizing volume data to a scale from 0 to 100, this indicator makes it easy to compare today's volume against recent history and gauge the strength of market movements.
Key Features:
Normalized Volume Index: The indicator indexes volume between 0 and 100, allowing traders to easily determine if the current volume is unusually high or low compared to recent trends.
Colored Visualization: The line graph is colored green for positive volume (increasing activity) and red for negative volume (decreasing activity). This helps traders quickly grasp the market sentiment and volume direction.
User-Defined Lookback Period: Traders can customize the lookback period to best fit their trading strategy, providing flexibility for different market conditions.
How Traders Can Use It:
Identifying Volume Extremes: The Volume Index helps identify periods of unusually high or low volume. Values approaching 100 indicate high volume, while values close to 0 indicate low volume.
Confirmation Tool: During price movements, high volume (near 100) can act as a confirmation signal for the strength of the trend. For instance, a high volume during an uptrend may indicate strong buying interest.
Divergence Analysis: Traders can look for divergences between volume and price. For example, if the price is consolidating while the Volume Index remains high, it could signal an impending breakout.
Volume Alerts: The indicator includes an alert feature when the Volume Index exceeds 80, helping traders stay informed about potential shifts in market volatility.
オープンソーススクリプト
TradingViewの精神に則り、このスクリプトの作者はコードをオープンソースとして公開してくれました。トレーダーが内容を確認・検証できるようにという配慮です。作者に拍手を送りましょう!無料で利用できますが、コードの再公開はハウスルールに従う必要があります。
免責事項
この情報および投稿は、TradingViewが提供または推奨する金融、投資、トレード、その他のアドバイスや推奨を意図するものではなく、それらを構成するものでもありません。詳細は利用規約をご覧ください。
オープンソーススクリプト
TradingViewの精神に則り、このスクリプトの作者はコードをオープンソースとして公開してくれました。トレーダーが内容を確認・検証できるようにという配慮です。作者に拍手を送りましょう!無料で利用できますが、コードの再公開はハウスルールに従う必要があります。
免責事項
この情報および投稿は、TradingViewが提供または推奨する金融、投資、トレード、その他のアドバイスや推奨を意図するものではなく、それらを構成するものでもありません。詳細は利用規約をご覧ください。