OPEN-SOURCE SCRIPT
AMHA + 4 EMAs + EMA50/200 Counter + Avg10Crosses
Description:
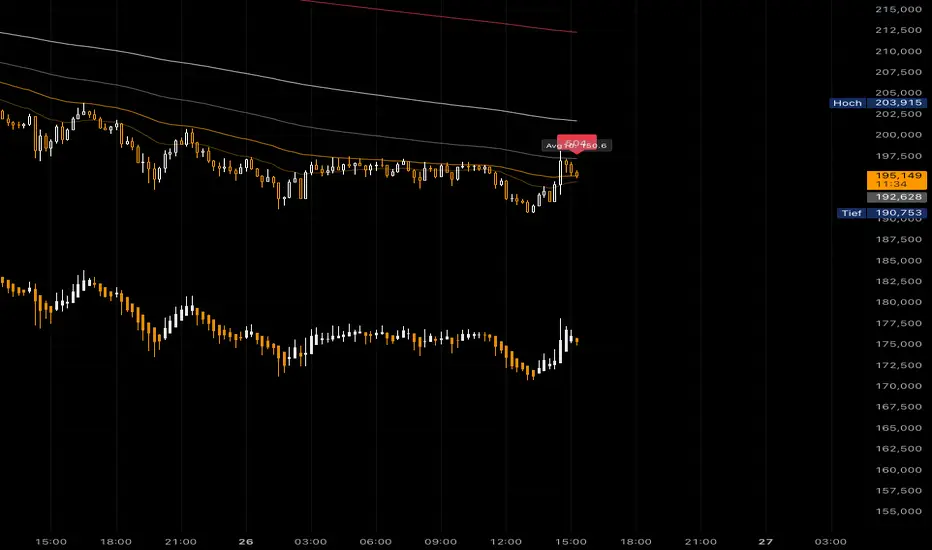
This script combines two types of Heikin-Ashi visualization with multiple Exponential Moving Averages (EMAs) and a counting function for EMA50/200 crossovers. The goal is to make trends more visible, measure recurring market cycles, and provide statistical context without generating trading signals.
Logic in Detail:
Adaptive Median Heikin-Ashi (AMHA):
Instead of the classic Heikin-Ashi calculation, this method uses the median of Open, High, Low, and Close. The result smooths out price movements, emphasizes trend direction, and reduces market noise.
Standard Heikin-Ashi Overlay:
Classic HA candles are also drawn in the background for comparison and transparency. Both HA types can be shifted below the chart’s price action using a customizable Offset (Ticks) parameter.
EMA Structure:
Five exponential moving averages (21, 50, 100, 200, 500) are included to highlight different trend horizons. EMA50 and EMA200 are emphasized, as their crossovers are widely monitored as potential trend signals. EMA21 and EMA100 serve as additional structure layers, while EMA500 represents the long-term trend.
EMA50/200 Counter:
The script counts how many bars have passed since the last EMA50/200 crossover. This makes it easy to see the age of the current trend phase. A colored label above the chart displays the current counter.
Average of the Last 10 Crossovers (Avg10Crosses):
The script stores the last 10 completed count phases and calculates their average length. This provides historical context and allows traders to compare the current cycle against typical past behavior.
Benefits for Analysis:
Clearer trend visualization through adaptive Heikin-Ashi calculation.
Multi-EMA setup for quick structural assessment.
Objective measurement of trend phase duration.
Statistical insight from the average cycle length of past EMA50/200 crosses.
Flexible visualization through adjustable offset positioning below the price chart.
Usage:
Add the indicator to your chart.
For a clean look, you may switch your chart type to “Line” or hide standard candlesticks.
Interpret visual signals:
White candles = bullish phases
Orange candles = bearish phases
EMAs = structural trend filters (e.g., EMA200 as a long-term boundary)
The counter label shows the current number of bars since the last cross, while Avg10 represents the historical mean.
Special Feature:
This script is not a trading system. It does not provide buy/sell recommendations. Instead, it serves as a visual and statistical tool for market structure analysis. The unique combination of Adaptive Median Heikin-Ashi, multi-EMA framework, and EMA50/200 crossover statistics makes it especially useful for trend-followers and swing traders who want to add cycle-length analysis to their toolkit.
オープンソーススクリプト
TradingViewの精神に則り、このスクリプトの作者はコードをオープンソースとして公開してくれました。トレーダーが内容を確認・検証できるようにという配慮です。作者に拍手を送りましょう!無料で利用できますが、コードの再公開はハウスルールに従う必要があります。
免責事項
この情報および投稿は、TradingViewが提供または推奨する金融、投資、トレード、その他のアドバイスや推奨を意図するものではなく、それらを構成するものでもありません。詳細は利用規約をご覧ください。
オープンソーススクリプト
TradingViewの精神に則り、このスクリプトの作者はコードをオープンソースとして公開してくれました。トレーダーが内容を確認・検証できるようにという配慮です。作者に拍手を送りましょう!無料で利用できますが、コードの再公開はハウスルールに従う必要があります。
免責事項
この情報および投稿は、TradingViewが提供または推奨する金融、投資、トレード、その他のアドバイスや推奨を意図するものではなく、それらを構成するものでもありません。詳細は利用規約をご覧ください。