OPEN-SOURCE SCRIPT
Consensio with colouring
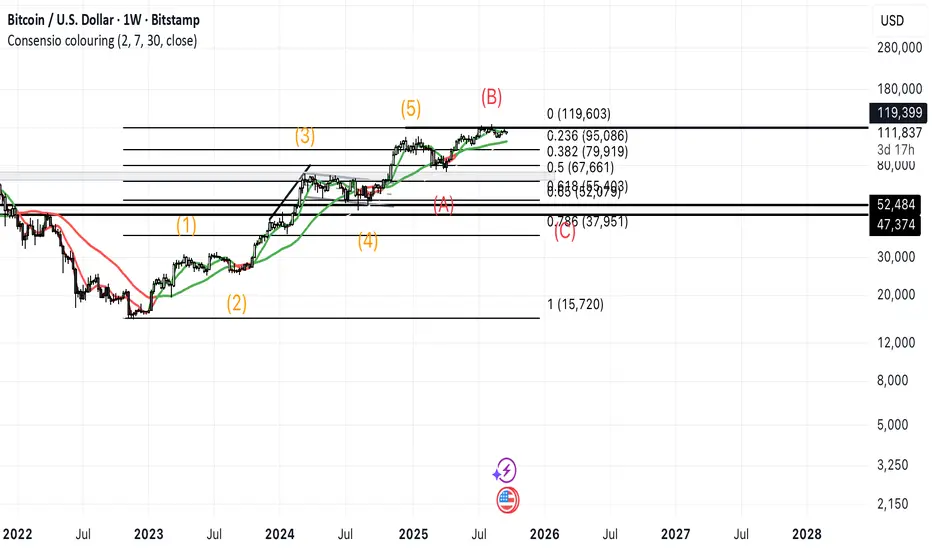
Consensio MA - Short MA with Colouring
This is a trend-following indicator based on the stacking order of three Simple Moving Averages (SMAs) to determine market consensus and visualize strength using a monochrome scale.
Key Features:
Three Customizable SMAs:
Fast MA (Default: 2)
Standard MA (Default: 7)
Slow MA (Default: 30)
Consensus Index:
The indicator assigns a score from +3 (Strongest Buy) to -3 (Strongest Sell) based on the MAs' vertical order (e.g., Fast > Standard > Slow is +3).
Monochrome Bar Colouring:
Bullish Consensus (+1 to +3): Bars are coloured in shades of White to Light Gray.
Bearish Consensus (-1 to -3): Bars are coloured in shades of Black to Dark Gray.
The intensity of the colour directly reflects the strength of the consensus.
Dynamic MA Line Colouring:
Fast MA: Changes colour upon crossing the Standard or Slow MA to signal short-term momentum shifts.
Standard MA: Changes to Green/Red when crossing the Slow MA.
Slow MA: Changes to Green/Red only when the strongest consensus (+3 or -3) is achieved.
How to Interpret:
Strong Bullish Trend (+3): MAs are perfectly aligned (Fast > Standard > Slow) and the bar is pure White.
Strong Bearish Trend (-3): MAs are perfectly reversed (Slow > Standard > Fast) and the bar is pure Black.
Contradictory Signals: Use the Fast MA's colour changes (Dark Green/Red) to spot immediate momentum changes even if the bar colour indicates a weaker trend.
オープンソーススクリプト
TradingViewの精神に則り、このスクリプトの作者はコードをオープンソースとして公開してくれました。トレーダーが内容を確認・検証できるようにという配慮です。作者に拍手を送りましょう!無料で利用できますが、コードの再公開はハウスルールに従う必要があります。
免責事項
この情報および投稿は、TradingViewが提供または推奨する金融、投資、トレード、その他のアドバイスや推奨を意図するものではなく、それらを構成するものでもありません。詳細は利用規約をご覧ください。
オープンソーススクリプト
TradingViewの精神に則り、このスクリプトの作者はコードをオープンソースとして公開してくれました。トレーダーが内容を確認・検証できるようにという配慮です。作者に拍手を送りましょう!無料で利用できますが、コードの再公開はハウスルールに従う必要があります。
免責事項
この情報および投稿は、TradingViewが提供または推奨する金融、投資、トレード、その他のアドバイスや推奨を意図するものではなく、それらを構成するものでもありません。詳細は利用規約をご覧ください。