OPEN-SOURCE SCRIPT
Stefan Krecher: Jeddingen Divergence
The main idea is to identify a divergence between momentum and price movement. E.g. if the momentum is rising but price is going down - this is what we call a divergence. The divergence will be calculated by comparing the direction of the linear regression curve of the price with the linear regression curve of momentum.
A bearish divergence can be identified by a thick red line, a bullish divergence by a green line.
When there is a divergence, it is likeley that the current trend will change it's direction.
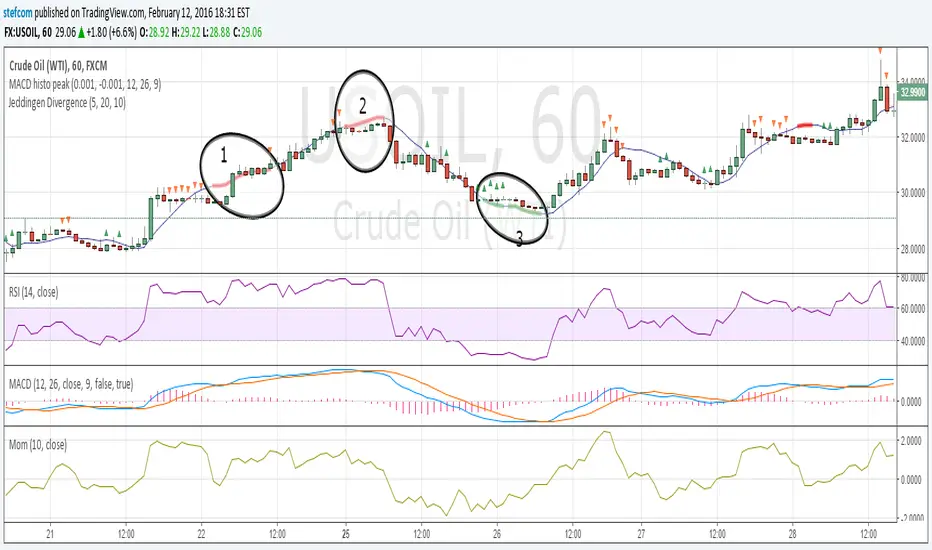
Looking at the chart, there are three divergences that need to get interpreted:
1) bearish divergence, RSI is overbought but MACD does not clearly indicate a trend change. Right after the divergence, price and momentum are going up. No clear signal for a sell trade
2) bearish divergence, RSI still overbought, MACD histogram peaked, MACD crossed the signal line, price and momentum are going down. Very clear constellation for a sell trade.
3) two bullish diverences, RSI is oversold, MACD crossover near the end of the second divergence, price and momentum started rising. Good constellation for a buy trade. Could act as exit signal for the beforementioned sell trade.
More information on the Jeddingen Divergence is available here: https://www.forexpython.com/strategy
A bearish divergence can be identified by a thick red line, a bullish divergence by a green line.
When there is a divergence, it is likeley that the current trend will change it's direction.
Looking at the chart, there are three divergences that need to get interpreted:
1) bearish divergence, RSI is overbought but MACD does not clearly indicate a trend change. Right after the divergence, price and momentum are going up. No clear signal for a sell trade
2) bearish divergence, RSI still overbought, MACD histogram peaked, MACD crossed the signal line, price and momentum are going down. Very clear constellation for a sell trade.
3) two bullish diverences, RSI is oversold, MACD crossover near the end of the second divergence, price and momentum started rising. Good constellation for a buy trade. Could act as exit signal for the beforementioned sell trade.
More information on the Jeddingen Divergence is available here: https://www.forexpython.com/strategy
オープンソーススクリプト
TradingViewの精神に則り、この作者はスクリプトのソースコードを公開しているので、その内容を理解し検証することができます。作者に感謝です!無料でお使いいただけますが、このコードを投稿に再利用する際にはハウスルールに従うものとします。
⚡ ProDivergence buy.stripe.com/3cs14e15h6FiaBy6oo
⚡ ProTrend buy.stripe.com/4gweV49BN5Be4da8wx
⚡ GET THE CCIDivergence STUDY FOR FREE: bit.ly/CCIDivFree
⚡ ProTrend buy.stripe.com/4gweV49BN5Be4da8wx
⚡ GET THE CCIDivergence STUDY FOR FREE: bit.ly/CCIDivFree
免責事項
これらの情報および投稿は、TradingViewが提供または保証する金融、投資、取引、またはその他の種類のアドバイスや推奨を意図したものではなく、またそのようなものでもありません。詳しくは利用規約をご覧ください。