INVITE-ONLY SCRIPT
更新済 Mayfair Volume Stochastic 1.0
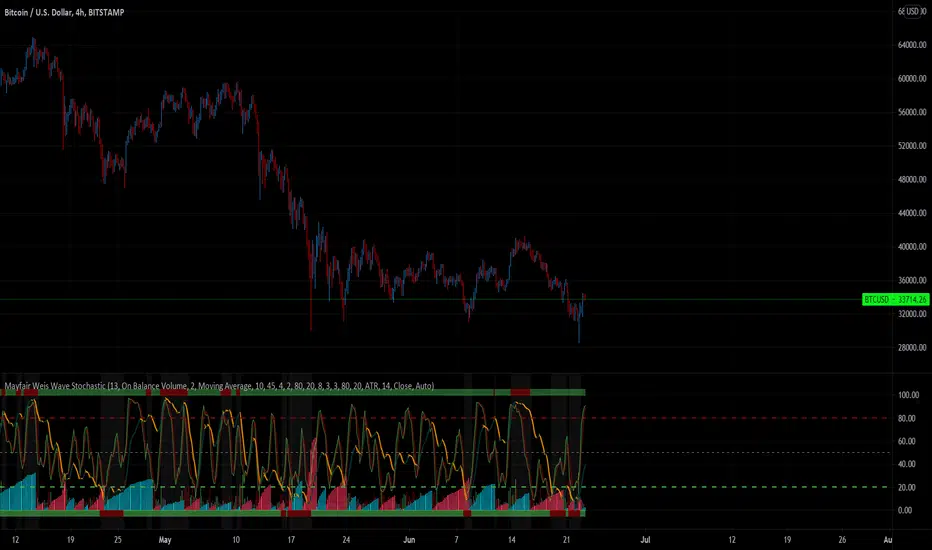
This indicator takes some of the simple tools such as RSI and Stochastic, and provides information of the macro picture for both trending and non-trending markets;
The Relative Strength Index part of the indicator is standard and is used in technical analysis that ranges between zero and one (or zero and 100 on some charting platforms.
This indicator has the ability to change between multiple settings; Elders Force Index, Money Flow Index, On Balance Volume & Price Volume Trend.
The Stochastic part is measuring not only the conventional Stochastic K – but also the accumulation/distribution and this is used with the volume bars at the bottom.
All are uniquely combined to give “False bar” signals when certain criteria is met – this is visualised by the Green turning Red on the upper and lower boundaries of the indicator. When Red, the trend is false, when green the trend is trending.
It’s a unique view of the market, confirmation of trend (false or not) inclusive of the volume profile across the bottom. Colour set to Red (Bearish), Green (Bullish) and Grey is undecisive volume.
リリースノート
This version adds a Weis Wave function. users can choose between Volume and Price displays by switching the setting Renko Assignment method from ATR to Traditional.You can also switch the standard volume deviation and the Weis Wave displays on and off to de-clutter the display.
リリースノート
Removed drawings on chart.リリースノート
The link was wrong, so updated招待専用スクリプト
このスクリプトは作者が承認したユーザーのみアクセス可能です。使用するにはアクセス申請をして許可を得る必要があります。通常は支払い後に承認されます。詳細は下記の作者の指示に従うか、Paul_Varcoeに直接お問い合わせください。
TradingViewは、作者を完全に信頼し、スクリプトの動作を理解していない限り、有料スクリプトの購入・使用を推奨しません。コミュニティスクリプトには無料のオープンソースの代替が多数あります。
作者の指示
To buy this indicator, please click here: https://launchpass.com/mayfair-trading-and-mentoring/stochastic. The link contains a video explaining the indicator in even more detail.
eBook ON SURVIVAL: amazon.co.uk/dp/B0BSY763W3
THE CITY TRADERS: thecitytraders.com/?aff=9
Discord: discord.gg/Ma7SnExcWA
THE CITY TRADERS: thecitytraders.com/?aff=9
Discord: discord.gg/Ma7SnExcWA
免責事項
この情報および投稿は、TradingViewが提供または推奨する金融、投資、トレード、その他のアドバイスや推奨を意図するものではなく、それらを構成するものでもありません。詳細は利用規約をご覧ください。
招待専用スクリプト
このスクリプトは作者が承認したユーザーのみアクセス可能です。使用するにはアクセス申請をして許可を得る必要があります。通常は支払い後に承認されます。詳細は下記の作者の指示に従うか、Paul_Varcoeに直接お問い合わせください。
TradingViewは、作者を完全に信頼し、スクリプトの動作を理解していない限り、有料スクリプトの購入・使用を推奨しません。コミュニティスクリプトには無料のオープンソースの代替が多数あります。
作者の指示
To buy this indicator, please click here: https://launchpass.com/mayfair-trading-and-mentoring/stochastic. The link contains a video explaining the indicator in even more detail.
eBook ON SURVIVAL: amazon.co.uk/dp/B0BSY763W3
THE CITY TRADERS: thecitytraders.com/?aff=9
Discord: discord.gg/Ma7SnExcWA
THE CITY TRADERS: thecitytraders.com/?aff=9
Discord: discord.gg/Ma7SnExcWA
免責事項
この情報および投稿は、TradingViewが提供または推奨する金融、投資、トレード、その他のアドバイスや推奨を意図するものではなく、それらを構成するものでもありません。詳細は利用規約をご覧ください。