OPEN-SOURCE SCRIPT
FIB vs HL
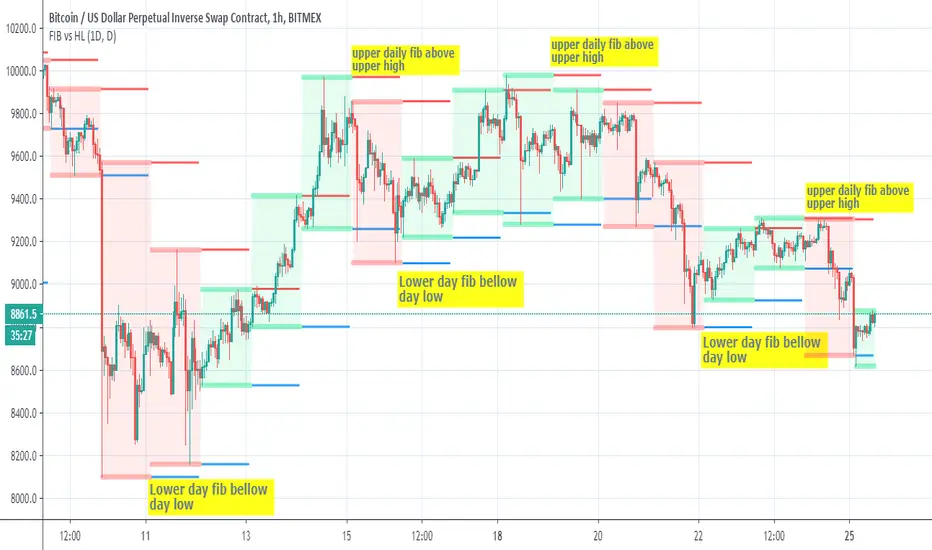
This script show the relation bettwen daily fib seen in red =upper and blue=lower to daily candles upper and lower
since there is slight variation how both calculated we can see that when daily fib is lower then the low candles daily low then there is a good chance for a buy trend
and vice versa in oposite direction
so it just a nice idea that need further verification
since there is slight variation how both calculated we can see that when daily fib is lower then the low candles daily low then there is a good chance for a buy trend
and vice versa in oposite direction
so it just a nice idea that need further verification
オープンソーススクリプト
TradingViewの精神に則り、このスクリプトの作者はコードをオープンソースとして公開してくれました。トレーダーが内容を確認・検証できるようにという配慮です。作者に拍手を送りましょう!無料で利用できますが、コードの再公開はハウスルールに従う必要があります。
免責事項
この情報および投稿は、TradingViewが提供または推奨する金融、投資、トレード、その他のアドバイスや推奨を意図するものではなく、それらを構成するものでもありません。詳細は利用規約をご覧ください。
オープンソーススクリプト
TradingViewの精神に則り、このスクリプトの作者はコードをオープンソースとして公開してくれました。トレーダーが内容を確認・検証できるようにという配慮です。作者に拍手を送りましょう!無料で利用できますが、コードの再公開はハウスルールに従う必要があります。
免責事項
この情報および投稿は、TradingViewが提供または推奨する金融、投資、トレード、その他のアドバイスや推奨を意図するものではなく、それらを構成するものでもありません。詳細は利用規約をご覧ください。