OPEN-SOURCE SCRIPT
更新済 Short Volume % of Total Volume
Short Volume % of Total Volume
This indicator plots the daily short volume as a percentage of total volume for a specific U.S. stock. The short volume is sourced from FINRA’s reported short sale data and is compared against the stock’s total trading volume for the same day.
📊 Use Cases:
Monitor short-selling pressure over time.
Identify spikes in short volume % that may signal increased bearish positioning.
Use in conjunction with price action to gauge sentiment shifts or potential short squeezes.
⚠️ Note: FINRA data reflects activity from FINRA-regulated trading venues only and may not represent full market-wide short activity.
リリースノート
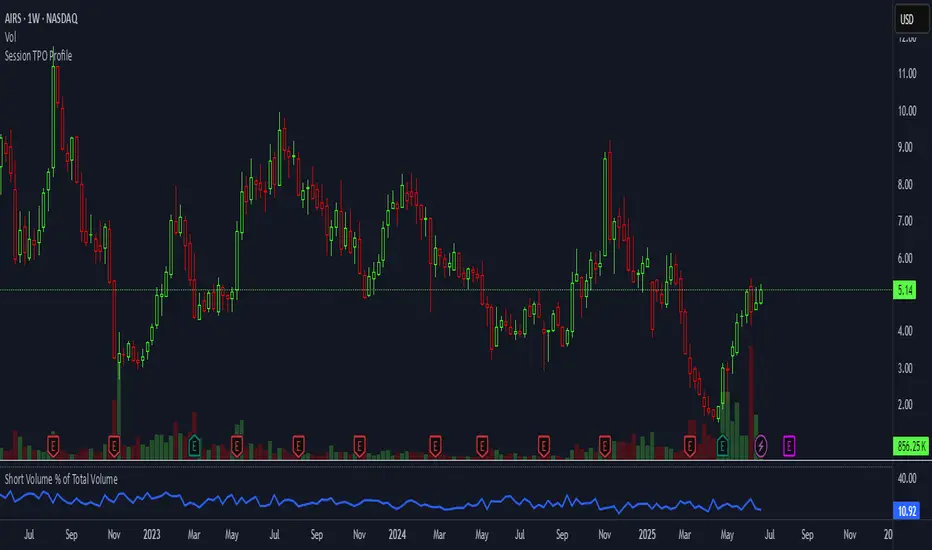
Short Volume % of Total VolumeThis indicator plots the daily short volume as a percentage of total volume for a specific U.S. stock. The short volume is sourced from FINRA’s reported short sale data and is compared against the stock’s total trading volume for the same day.
📌 Key Features:
Pulls FINRA short volume data (FINRA:[TICKER]_SHORT_VOLUME)
Calculates short volume as a percentage of daily total volume
Includes a 50% reference line to help spot above-average shorting activity
Updates daily but displays on any chart timeframe
📊 Use Cases:
Monitor short-selling pressure over time
Identify spikes in short volume % that may signal increased bearish positioning
Use in conjunction with price action to gauge sentiment shifts or potential short squeezes
⚠️ Note: FINRA data reflects activity from FINRA-regulated trading venues only and may not represent full market-wide short activity.
オープンソーススクリプト
TradingViewの精神に則り、このスクリプトの作者はコードをオープンソースとして公開してくれました。トレーダーが内容を確認・検証できるようにという配慮です。作者に拍手を送りましょう!無料で利用できますが、コードの再公開はハウスルールに従う必要があります。
免責事項
この情報および投稿は、TradingViewが提供または推奨する金融、投資、トレード、その他のアドバイスや推奨を意図するものではなく、それらを構成するものでもありません。詳細は利用規約をご覧ください。
オープンソーススクリプト
TradingViewの精神に則り、このスクリプトの作者はコードをオープンソースとして公開してくれました。トレーダーが内容を確認・検証できるようにという配慮です。作者に拍手を送りましょう!無料で利用できますが、コードの再公開はハウスルールに従う必要があります。
免責事項
この情報および投稿は、TradingViewが提供または推奨する金融、投資、トレード、その他のアドバイスや推奨を意図するものではなく、それらを構成するものでもありません。詳細は利用規約をご覧ください。