PROTECTED SOURCE SCRIPT
更新済 Market Balance
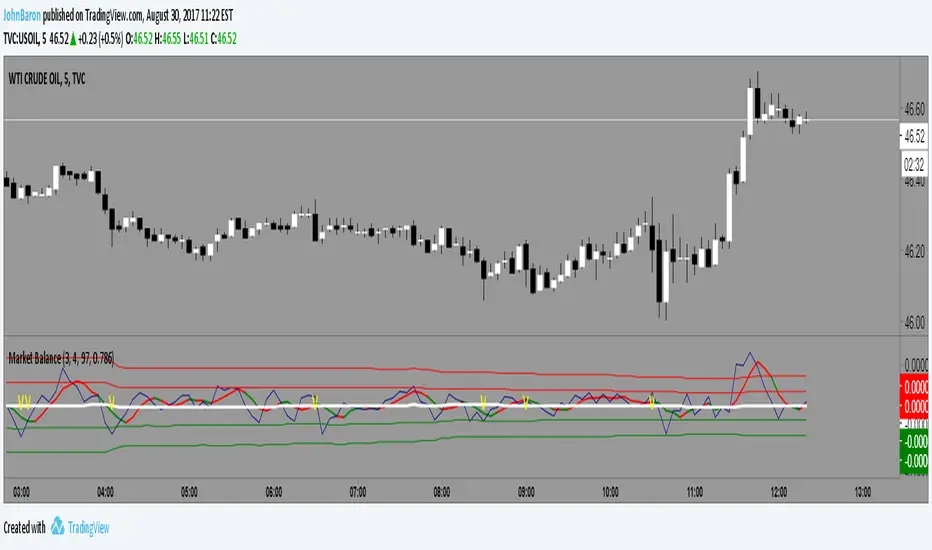
This indicator simply tracks the balance of the supply/demand and will always revert to the mean.
If the market is over bought it will move above the mean, hit a limit and come back toward the mean. Opposite for oversold.
The difference between this and MFI or RSI is that a market can move up or down in an organized fashion and stay close to the mean. It is impulsive moves up or down that will correct.
So a trader might be able to gauge whether an given stock has the likelihood to pullback or bounce based on this indicator.
The color indicator attempts to predict the color of the next bar.
Works well with Heiken Ashi style candles as well.
リリースノート
Added .. balance zoneリリースノート
Some small aesthetics.Note, the color indicator on the moving average is a prediction of the next bar color.
保護スクリプト
このスクリプトのソースコードは非公開で投稿されています。 ただし、制限なく自由に使用できます – 詳細はこちらでご確認ください。
免責事項
この情報および投稿は、TradingViewが提供または推奨する金融、投資、トレード、その他のアドバイスや推奨を意図するものではなく、それらを構成するものでもありません。詳細は利用規約をご覧ください。
免責事項
この情報および投稿は、TradingViewが提供または推奨する金融、投資、トレード、その他のアドバイスや推奨を意図するものではなく、それらを構成するものでもありません。詳細は利用規約をご覧ください。