OPEN-SOURCE SCRIPT
RSI Curl Signals 70 / 60 / 40
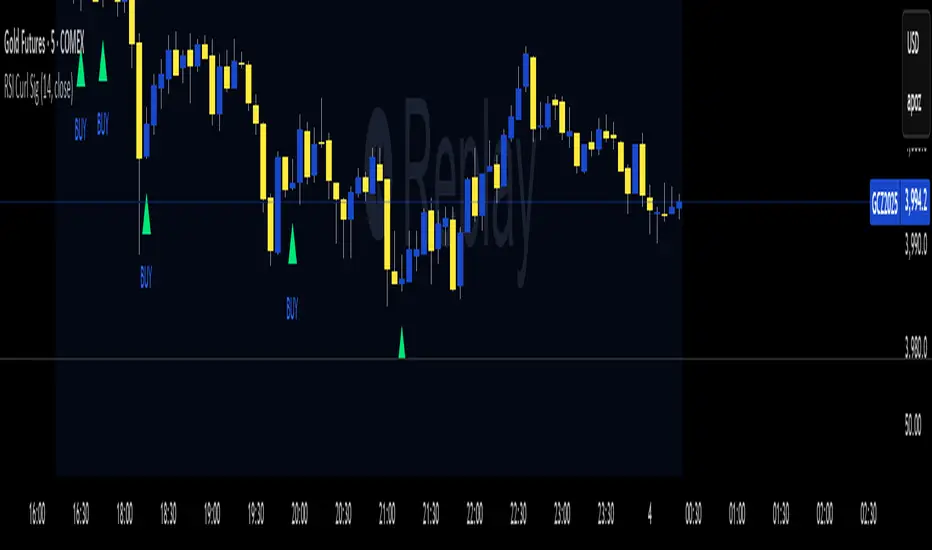
This Indicator Identifies the turning points on the RSI and plots a buy and sell signal on the chart It plots on crossing up above the 41 Level on the RSI and plots a sell curling below the 60 level use a standard RSI on chart if needed with alerts set at RSI curling up above value 40 Level and use an alert for curling below Level 60 use support and resistance for confirmation
Works with any timeframe Ans any asset
Works with any timeframe Ans any asset
オープンソーススクリプト
TradingViewの精神に則り、この作者はスクリプトのソースコードを公開しているので、その内容を理解し検証することができます。作者に感謝です!無料でお使いいただけますが、このコードを投稿に再利用する際にはハウスルールに従うものとします。
免責事項
これらの情報および投稿は、TradingViewが提供または保証する金融、投資、取引、またはその他の種類のアドバイスや推奨を意図したものではなく、またそのようなものでもありません。詳しくは利用規約をご覧ください。
オープンソーススクリプト
TradingViewの精神に則り、この作者はスクリプトのソースコードを公開しているので、その内容を理解し検証することができます。作者に感謝です!無料でお使いいただけますが、このコードを投稿に再利用する際にはハウスルールに従うものとします。
免責事項
これらの情報および投稿は、TradingViewが提供または保証する金融、投資、取引、またはその他の種類のアドバイスや推奨を意図したものではなく、またそのようなものでもありません。詳しくは利用規約をご覧ください。