OPEN-SOURCE SCRIPT
更新済 Table Identifies the Price Extensively Using RSI, MA, and ATR
⬤ INDICATOR KEY

⬤ INTRODUCTION
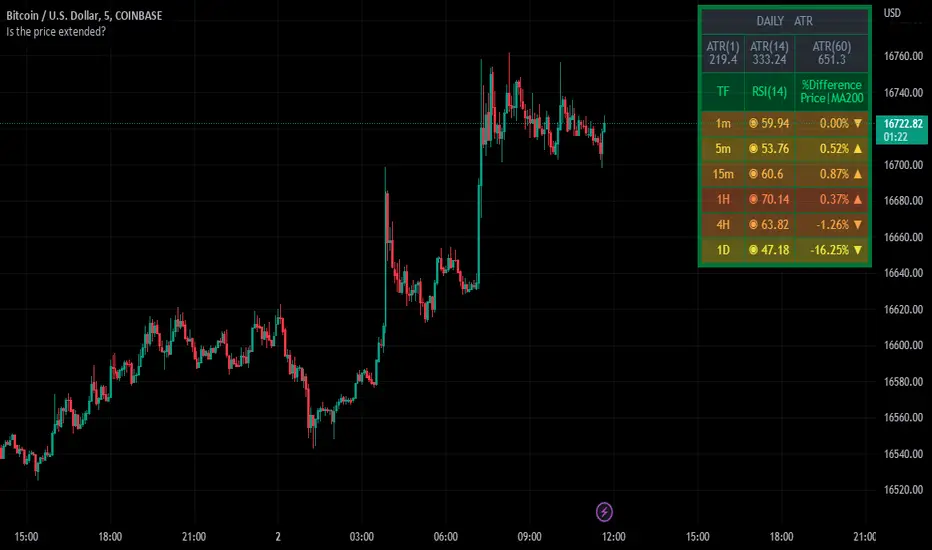
The indicator has presented as a table to show the perspective result of different indicators to help the user identify the status of the price if it’s extended or not. The table starts with the ATR section, which gives out a better look to compare the current day’s candle wide versus the average candle wide of a certain length of period that selected by the user. The second section of the table, showing RSI values at the most common upper timeframes, and the different percentages between the current price and long-term moving average entered by the user.
⬤ INDICATOR OVERVIEW

⬤ FINAL COMMENTS
▸This’s not a trading signal, but it helps to make a trading decision whether to set targets, stop loss, and enter a new trade.
▸If you found this content useful, please consider supporting presented indicators projects through PayPal which mentioned in the signature box, below.
▸ Trade Safe✌️.
⬤ OTHER GREAT INDICATORS CREATED BY MUQWISHI
📈 Muqwishi Volumetric Candle
📈 Support and Resistance For Day Trader | By MUQWISHI
⬤ INTRODUCTION
The indicator has presented as a table to show the perspective result of different indicators to help the user identify the status of the price if it’s extended or not. The table starts with the ATR section, which gives out a better look to compare the current day’s candle wide versus the average candle wide of a certain length of period that selected by the user. The second section of the table, showing RSI values at the most common upper timeframes, and the different percentages between the current price and long-term moving average entered by the user.
⬤ INDICATOR OVERVIEW
⬤ FINAL COMMENTS
▸This’s not a trading signal, but it helps to make a trading decision whether to set targets, stop loss, and enter a new trade.
▸If you found this content useful, please consider supporting presented indicators projects through PayPal which mentioned in the signature box, below.
▸ Trade Safe✌️.
⬤ OTHER GREAT INDICATORS CREATED BY MUQWISHI
📈 Muqwishi Volumetric Candle
📈 Support and Resistance For Day Trader | By MUQWISHI
リリースノート
Table Identifies the Price Extensively Using RSI, MA, and ATR V2▮ Version 2, Updates:
1- Improved Code.
2- Made it works on a pre-market session.
3- Improved colors options.
4- User can custom timeframes.
5- It'll show all timeframes.
オープンソーススクリプト
TradingViewの精神に則り、このスクリプトの作者はコードをオープンソースとして公開してくれました。トレーダーが内容を確認・検証できるようにという配慮です。作者に拍手を送りましょう!無料で利用できますが、コードの再公開はハウスルールに従う必要があります。
Trusted Pine Programmer, For Coding Inquiries
► Website muqwishi.com/home/quotation/
► Telegram t.me/MUQWISHI
► Email service@muqwishi.com
⛾ Support My Work on “Buy Me a Coffee” buymeacoffee.com/muqwishi
► Website muqwishi.com/home/quotation/
► Telegram t.me/MUQWISHI
► Email service@muqwishi.com
⛾ Support My Work on “Buy Me a Coffee” buymeacoffee.com/muqwishi
免責事項
この情報および投稿は、TradingViewが提供または推奨する金融、投資、トレード、その他のアドバイスや推奨を意図するものではなく、それらを構成するものでもありません。詳細は利用規約をご覧ください。