OPEN-SOURCE SCRIPT
ka66: Triple Keltner Around Source
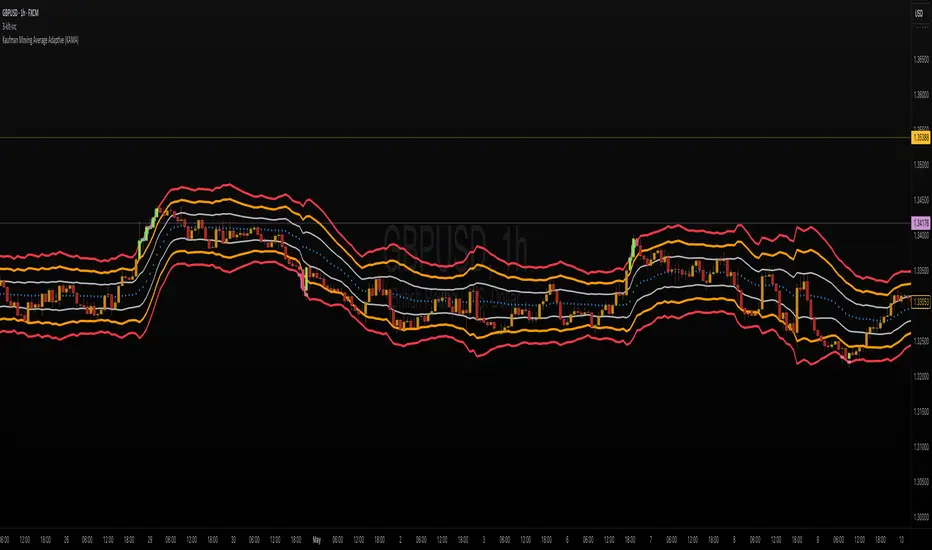
This is an indicator-on-indicator which draws Keltner Bands (ATR Bands) around any selected Basis Source, instead of hardcoding a moving average, etc. This allows you to put bands around any sort of esoteric moving average of your choice, or even just around price data like OHLC, HLC3, and so on.
It's an enhancement on my prior Multi ATR Channels script at
Written in Pine v6 and allowing custom timeframe selection.
For example, the published chart shows the bands place around a Kaufman Adaptive Moving Average (KAMA), plotted in blue dots.
You would use it for anything that you would use plain Keltners for:
But with any basis that you deem more suitable for your purposes.
It's an enhancement on my prior Multi ATR Channels script at
Written in Pine v6 and allowing custom timeframe selection.
For example, the published chart shows the bands place around a Kaufman Adaptive Moving Average (KAMA), plotted in blue dots.
You would use it for anything that you would use plain Keltners for:
- Mean Reversion
- Breakouts
- Take Profit and Stop Loss Estimation
But with any basis that you deem more suitable for your purposes.
オープンソーススクリプト
TradingViewの精神に則り、このスクリプトの作者はコードをオープンソースとして公開してくれました。トレーダーが内容を確認・検証できるようにという配慮です。作者に拍手を送りましょう!無料で利用できますが、コードの再公開はハウスルールに従う必要があります。
免責事項
この情報および投稿は、TradingViewが提供または推奨する金融、投資、トレード、その他のアドバイスや推奨を意図するものではなく、それらを構成するものでもありません。詳細は利用規約をご覧ください。
オープンソーススクリプト
TradingViewの精神に則り、このスクリプトの作者はコードをオープンソースとして公開してくれました。トレーダーが内容を確認・検証できるようにという配慮です。作者に拍手を送りましょう!無料で利用できますが、コードの再公開はハウスルールに従う必要があります。
免責事項
この情報および投稿は、TradingViewが提供または推奨する金融、投資、トレード、その他のアドバイスや推奨を意図するものではなく、それらを構成するものでもありません。詳細は利用規約をご覧ください。