OPEN-SOURCE SCRIPT
Didi Index
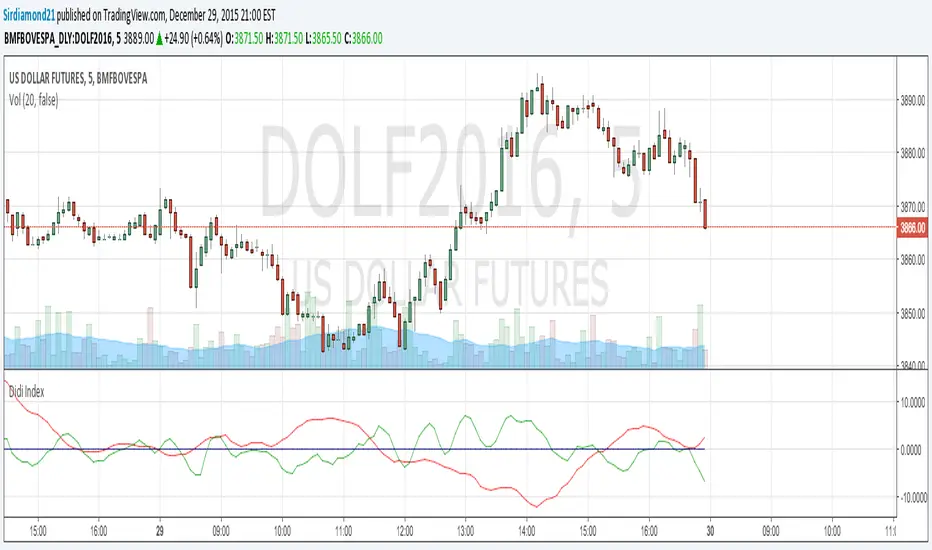
Indicator developed by Brazilian and analyst Odir Aguiar (Didi), consists of "Moving Averages", known for the famous needles Didi, which allows the visualization of reversal points.
The concept is very simple, when you insert 3 Moving Averages on display, one of three periods, an 8 and the other 20, there appears the formation of the indicator which works on an axis or center line 0. The needles occur when the intersection of averages comes closest to the line 0.
The concept is very simple, when you insert 3 Moving Averages on display, one of three periods, an 8 and the other 20, there appears the formation of the indicator which works on an axis or center line 0. The needles occur when the intersection of averages comes closest to the line 0.
オープンソーススクリプト
TradingViewの精神に則り、このスクリプトの作者はコードをオープンソースとして公開してくれました。トレーダーが内容を確認・検証できるようにという配慮です。作者に拍手を送りましょう!無料で利用できますが、コードの再公開はハウスルールに従う必要があります。
免責事項
この情報および投稿は、TradingViewが提供または推奨する金融、投資、トレード、その他のアドバイスや推奨を意図するものではなく、それらを構成するものでもありません。詳細は利用規約をご覧ください。
オープンソーススクリプト
TradingViewの精神に則り、このスクリプトの作者はコードをオープンソースとして公開してくれました。トレーダーが内容を確認・検証できるようにという配慮です。作者に拍手を送りましょう!無料で利用できますが、コードの再公開はハウスルールに従う必要があります。
免責事項
この情報および投稿は、TradingViewが提供または推奨する金融、投資、トレード、その他のアドバイスや推奨を意図するものではなく、それらを構成するものでもありません。詳細は利用規約をご覧ください。