OPEN-SOURCE SCRIPT
更新済 AlphaDragon: Data visualizer
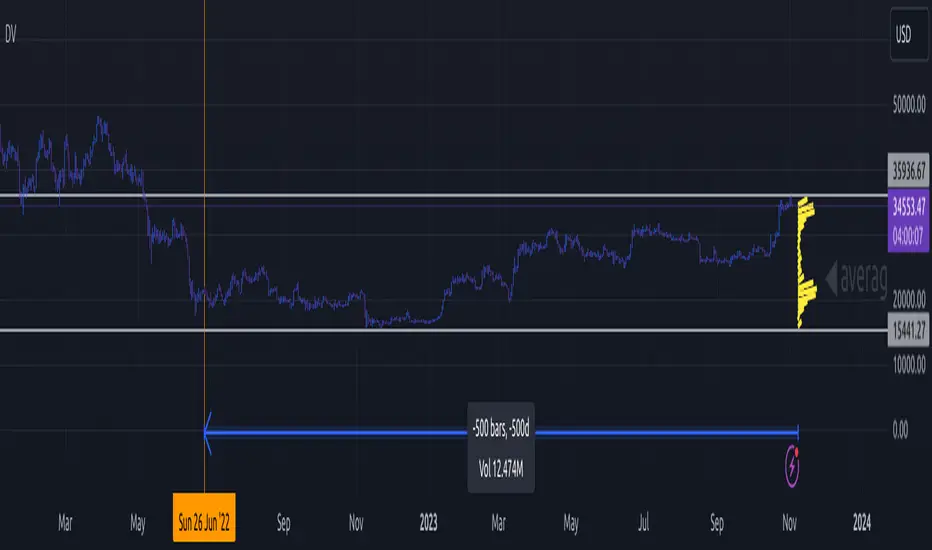
Aggregates source data into 2D vertical histogram.
Aggregates samples (lenght) in a window (from 0% to 100%). N samples are gathered in 1% brackets.
Visualizer gathers 5% of each window, and display width corresponding to amount of samples, in that bracket.
Aggregates samples (lenght) in a window (from 0% to 100%). N samples are gathered in 1% brackets.
Visualizer gathers 5% of each window, and display width corresponding to amount of samples, in that bracket.
リリースノート
Added math.round - but it does not fix the graph drawリリースノート
Updated histogramin next version:
- projected two types of histogram
- Better, its own X/Y chart (one type)
- Updated this 2D as an overlay
リリースノート
updated chartオープンソーススクリプト
TradingViewの精神に則り、このスクリプトの作者はコードをオープンソースとして公開してくれました。トレーダーが内容を確認・検証できるようにという配慮です。作者に拍手を送りましょう!無料で利用できますが、コードの再公開はハウスルールに従う必要があります。
免責事項
この情報および投稿は、TradingViewが提供または推奨する金融、投資、トレード、その他のアドバイスや推奨を意図するものではなく、それらを構成するものでもありません。詳細は利用規約をご覧ください。
オープンソーススクリプト
TradingViewの精神に則り、このスクリプトの作者はコードをオープンソースとして公開してくれました。トレーダーが内容を確認・検証できるようにという配慮です。作者に拍手を送りましょう!無料で利用できますが、コードの再公開はハウスルールに従う必要があります。
免責事項
この情報および投稿は、TradingViewが提供または推奨する金融、投資、トレード、その他のアドバイスや推奨を意図するものではなく、それらを構成するものでもありません。詳細は利用規約をご覧ください。