OPEN-SOURCE SCRIPT
Vrext- Advanced EMA Zone
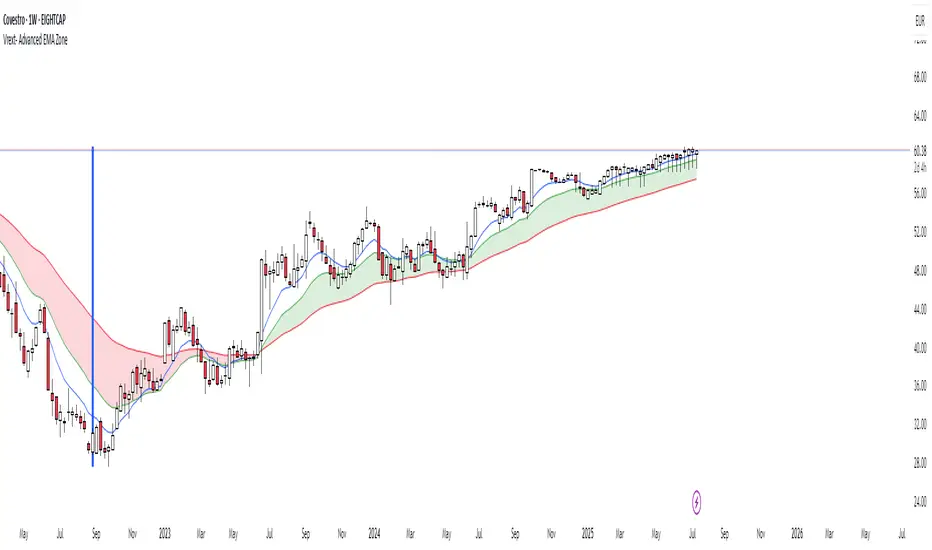
The indicator highlights an area between two manually adjustable EMA-s to visibly mark a zone. A zone where the larger EMA is bellow the smaller one (indicating an uptrend) is marked green. On the opposite hand where higher EMA is above the lower the zone (indicating a downtrend) is marked red.
For correct zone marking enter EMA-s in descending order.
The indicator also allows you to add further additional EMA-s, which do not have a zone drawn between them and are just stand alone EMA-s. They are fully customisable in terms of colour, width. etc.
Additionally the indicator allows you to plot a vertical line ''xyz'' candles in the past. The idea behind it is that if you want to only focus on the previous 150 candles, there will be a clear line at the 150th candle for easier navigating.
オープンソーススクリプト
TradingViewの精神に則り、このスクリプトの作者はコードをオープンソースとして公開してくれました。トレーダーが内容を確認・検証できるようにという配慮です。作者に拍手を送りましょう!無料で利用できますが、コードの再公開はハウスルールに従う必要があります。
免責事項
この情報および投稿は、TradingViewが提供または推奨する金融、投資、トレード、その他のアドバイスや推奨を意図するものではなく、それらを構成するものでもありません。詳細は利用規約をご覧ください。
オープンソーススクリプト
TradingViewの精神に則り、このスクリプトの作者はコードをオープンソースとして公開してくれました。トレーダーが内容を確認・検証できるようにという配慮です。作者に拍手を送りましょう!無料で利用できますが、コードの再公開はハウスルールに従う必要があります。
免責事項
この情報および投稿は、TradingViewが提供または推奨する金融、投資、トレード、その他のアドバイスや推奨を意図するものではなく、それらを構成するものでもありません。詳細は利用規約をご覧ください。