OPEN-SOURCE SCRIPT
PE Range
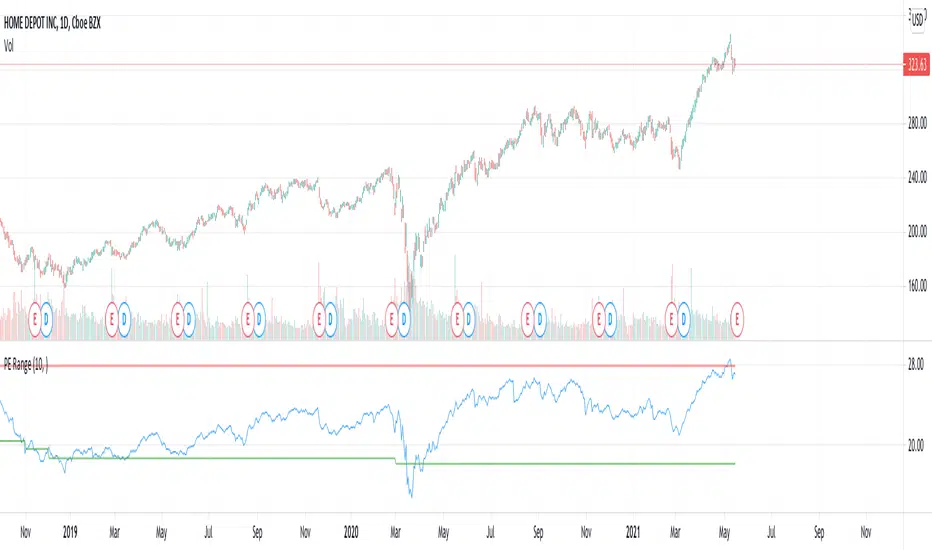
Here is an attempt to mix fundamentals with technicals.
Study plots PE ratio on charts. We also plot historical max and min PE ratio based on loopback years input.
Apparently, tradingview has capability to get historical financials into charts and make use of them in our trading strategies.
tradingview.com/?solution=43000564727
Will be exploring them further.
オープンソーススクリプト
TradingViewの精神に則り、このスクリプトの作者はコードをオープンソースとして公開してくれました。トレーダーが内容を確認・検証できるようにという配慮です。作者に拍手を送りましょう!無料で利用できますが、コードの再公開はハウスルールに従う必要があります。
Trial - trendoscope.io/trial
Subscribe - trendoscope.io/pricing
Blog - docs.trendoscope.io
Subscribe - trendoscope.io/pricing
Blog - docs.trendoscope.io
免責事項
この情報および投稿は、TradingViewが提供または推奨する金融、投資、トレード、その他のアドバイスや推奨を意図するものではなく、それらを構成するものでもありません。詳細は利用規約をご覧ください。