INVITE-ONLY SCRIPT
MRT, Barcolor for Trend Direction
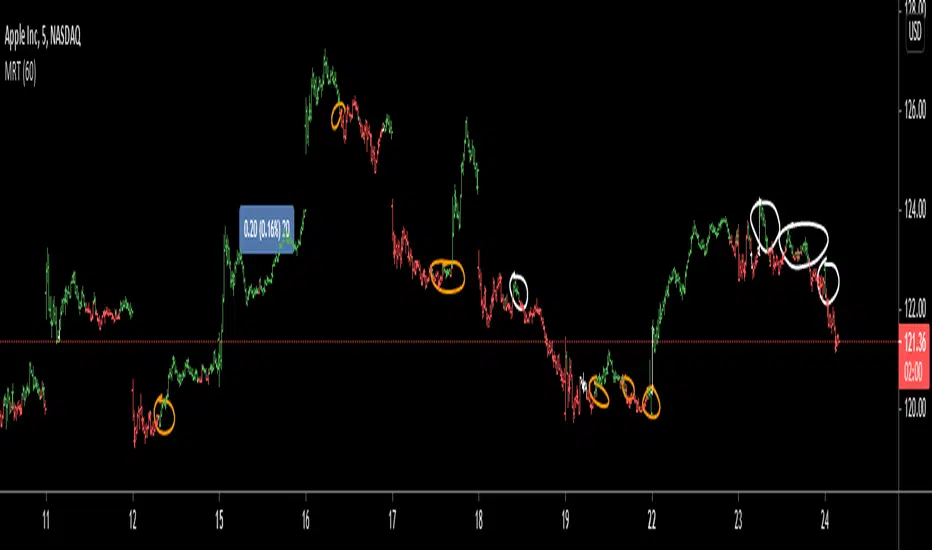
This is an indicator that I use to identify trend.
1- This is AAPL five minutes chart
A-Yellow Circles on the chart: Green is a Buy ,Red is a Sell
B-The white bars are transition to to the opposite color (red to green or vic versa ) it can serve as a warning of trend change.
C-As with any signal , sometimes it is a false signal (the white circles you see there). However, I would stick to the signal each time it changes.
2-The indicator uses previous highs and lows based on different time frames that you select. and calculate the winners and losers.
3-
A-I personally choose shorter time frame ( Hour, 30 minutes, even 1 minute) because I want faster signals to trade short term.
B-However, you can use it for longer term if you trade on longer time frames.
c-Whatever timeframe you use , choose lower for the candle; For example, if you use the One-Hour for the indicator then apply it to the five minutes chart. I use the 30 seconds chart.
4-This indicator will not guarantee any returns.
comment if you have any question.
1- This is
A-Yellow Circles on the chart: Green is a Buy ,Red is a Sell
B-The white bars are transition to to the opposite color (red to green or vic versa ) it can serve as a warning of trend change.
C-As with any signal , sometimes it is a false signal (the white circles you see there). However, I would stick to the signal each time it changes.
2-The indicator uses previous highs and lows based on different time frames that you select. and calculate the winners and losers.
3-
A-I personally choose shorter time frame ( Hour, 30 minutes, even 1 minute) because I want faster signals to trade short term.
B-However, you can use it for longer term if you trade on longer time frames.
c-Whatever timeframe you use , choose lower for the candle; For example, if you use the One-Hour for the indicator then apply it to the five minutes chart. I use the 30 seconds chart.
4-This indicator will not guarantee any returns.
comment if you have any question.
招待専用スクリプト
こちらのスクリプトにアクセスできるのは投稿者が承認したユーザーだけです。投稿者にリクエストして使用許可を得る必要があります。通常の場合、支払い後に許可されます。詳細については、以下、作者の指示をお読みになるか、malrawiに直接ご連絡ください。
スクリプトの機能を理解し、その作者を全面的に信頼しているのでなければ、お金を支払ってまでそのスクリプトを利用することをTradingViewとしては「非推奨」としています。コミュニティスクリプトの中で、その代わりとなる無料かつオープンソースのスクリプトを見つけられる可能性もあります。
作者の指示
PM me on Tradingview messages for 3 months trial
免責事項
これらの情報および投稿は、TradingViewが提供または保証する金融、投資、取引、またはその他の種類のアドバイスや推奨を意図したものではなく、またそのようなものでもありません。詳しくは利用規約をご覧ください。