OPEN-SOURCE SCRIPT
Bollinger Bands Fast Trend Indicator [DCD]
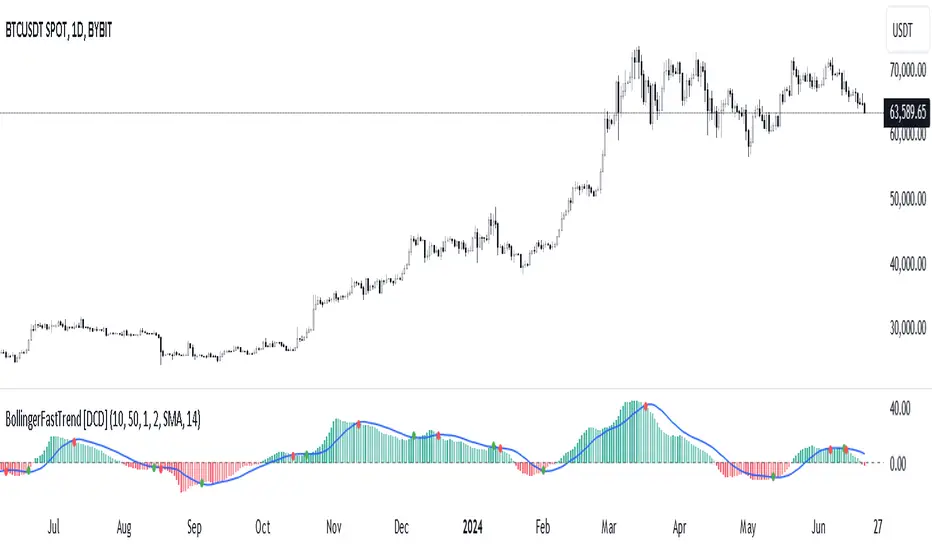
Description:
The Bollinger Bands Fast Trend Detector indicator is an advanced tool designed to provide traders with more precise trend detection and clearer entry and exit signals. This script builds upon the traditional Bollinger Bands indicator by adding customizable standard deviations and incorporating multiple moving averages to enhance the accuracy of the signals.
Main Features:
1. **Customizable Bollinger Bands**:
- Each Bollinger Band has its own standard deviation setting, allowing for more granular control and better trend detection.
- The short Bollinger Band is set to a 10-period SMA for faster trend recognition.
2. **Multiple Moving Averages**:
- The indicator includes several types of moving averages (SMA, EMA, LSMA, HMA, WMA) applied to the Bollinger Trend value, giving traders flexibility to choose the best fit for their strategy.
3. **Crossover and Crossdown Detection**:
- The script identifies crossover and crossdown points between the Bollinger Trend value and the selected moving average, marking potential buy and sell signals with green and red circles, respectively.
4. **Color-Coded Histogram**:
- The histogram bars are color-coded to indicate the strength and direction of the trend, making it easy to visualize market conditions at a glance.
Instructions:
1. **Adding the Script to Your Chart**:
- Open your TradingView chart and add the Bollinger Bands Fast Trend Detector indicator.
2. **Adjusting Parameters**:
- Customize the Bollinger Bands and moving average settings according to your trading preferences:
- `Short BB Length` (default: 10): Adjusts the length of the short Bollinger Band.
- `Long BB Length` (default: 50): Adjusts the length of the long Bollinger Band.
- `StdDev` (for both bands): Sets the standard deviation multiplier.
- `Moving Average Type`: Choose between SMA, EMA, LSMA, HMA, and WMA.
- `Moving Average Length` (default: 14): Sets the length of the moving average.
3. **Interpreting the Output**:
- Observe the BBTrend and moving average plots on your chart.
- Look for green circles indicating crossover points (potential buy signals) and red circles indicating crossdown points (potential sell signals).
- Use the color-coded histogram bars to assess the strength and direction of the trend.
Configurable Parameters:
- `shortLengthInput` (default: 10): Length of the short Bollinger Band.
- `longLengthInput` (default: 50): Length of the long Bollinger Band.
- `shortDevMultInput` (default: 1.0): Standard deviation multiplier for the short Bollinger Band.
- `longDevMultInput` (default: 2.0): Standard deviation multiplier for the long Bollinger Band.
- `maTypeInput` (default: SMA): Type of moving average (options: SMA, EMA, LSMA, HMA, WMA).
- `maLengthInput` (default: 14): Length of the moving average.
Code Explanation:
The script calculates two sets of Bollinger Bands with distinct lengths and standard deviations. The difference between the lower bands and upper bands is normalized by the short middle band to compute the BBTrend value. A selected moving average is then applied to this BBTrend value. The script plots the BBTrend, the moving average, and uses color-coded histogram bars to represent trend strength and direction. It also identifies and marks crossover and crossdown points to provide potential trading signals.
Disclaimer:
This script is for educational purposes only and should not be considered financial advice. Always perform your own analysis before making any trading decisions.
オープンソーススクリプト
TradingViewの精神に則り、このスクリプトの作者はコードをオープンソースとして公開してくれました。トレーダーが内容を確認・検証できるようにという配慮です。作者に拍手を送りましょう!無料で利用できますが、コードの再公開はハウスルールに従う必要があります。
免責事項
この情報および投稿は、TradingViewが提供または推奨する金融、投資、トレード、その他のアドバイスや推奨を意図するものではなく、それらを構成するものでもありません。詳細は利用規約をご覧ください。
オープンソーススクリプト
TradingViewの精神に則り、このスクリプトの作者はコードをオープンソースとして公開してくれました。トレーダーが内容を確認・検証できるようにという配慮です。作者に拍手を送りましょう!無料で利用できますが、コードの再公開はハウスルールに従う必要があります。
免責事項
この情報および投稿は、TradingViewが提供または推奨する金融、投資、トレード、その他のアドバイスや推奨を意図するものではなく、それらを構成するものでもありません。詳細は利用規約をご覧ください。