OPEN-SOURCE SCRIPT
111D SMA / (350D SMA * 2)
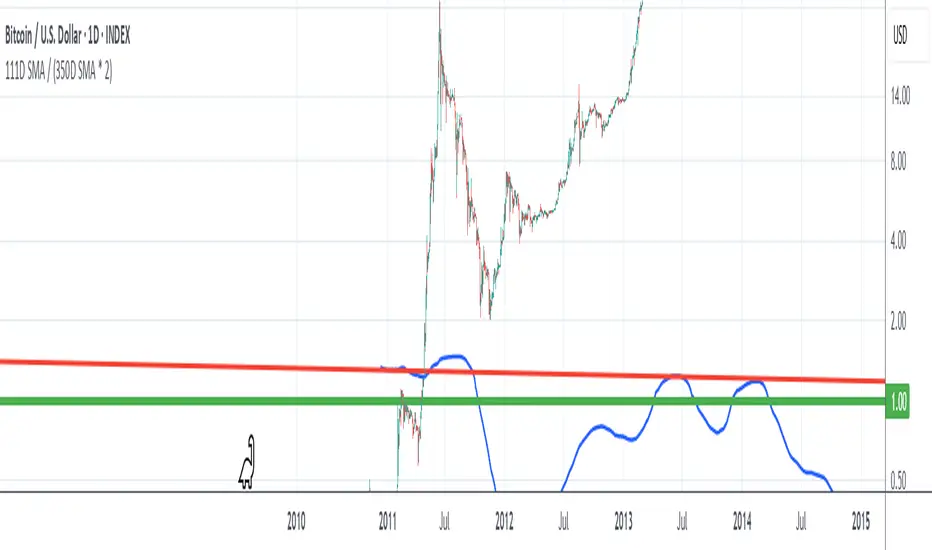
Indicator: Pi Cycle Ratio
This custom technical indicator calculates a ratio between two moving averages that are used for the PI Cycle Top indicator. The PI Cycle Top indicator triggers when the 111-day simple moving average (111D SMA) crosses up with the 350-day simple moving average (350D SMA *2).
The line value is ratio is calculated as:
Line Value = 111DSMA / (350D SMA × 2)
When the 111D SMA crosses with the 350D SMA triggering the PI Cycle Top, the value of the ratio between the two lines is 1.
This visualizes the ratio between the two moving averages into a single line. This indicator can be used for technical analysis for historical and future moves.
オープンソーススクリプト
TradingViewの精神に則り、このスクリプトの作者はコードをオープンソースとして公開してくれました。トレーダーが内容を確認・検証できるようにという配慮です。作者に拍手を送りましょう!無料で利用できますが、コードの再公開はハウスルールに従う必要があります。
免責事項
この情報および投稿は、TradingViewが提供または推奨する金融、投資、トレード、その他のアドバイスや推奨を意図するものではなく、それらを構成するものでもありません。詳細は利用規約をご覧ください。
オープンソーススクリプト
TradingViewの精神に則り、このスクリプトの作者はコードをオープンソースとして公開してくれました。トレーダーが内容を確認・検証できるようにという配慮です。作者に拍手を送りましょう!無料で利用できますが、コードの再公開はハウスルールに従う必要があります。
免責事項
この情報および投稿は、TradingViewが提供または推奨する金融、投資、トレード、その他のアドバイスや推奨を意図するものではなく、それらを構成するものでもありません。詳細は利用規約をご覧ください。