OPEN-SOURCE SCRIPT
更新済 ICT IPDA Look Back
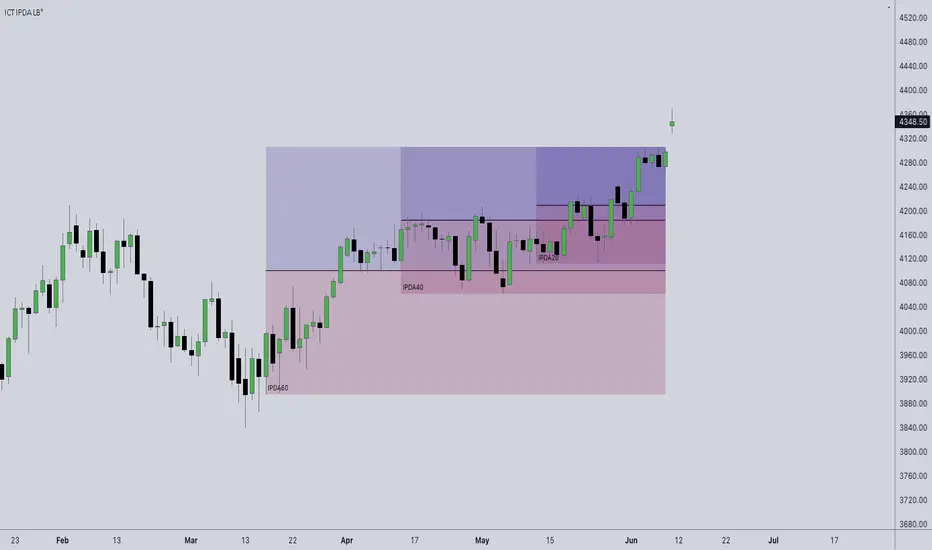
This script automatically calculates and updates ICT's daily IPDA look back time intervals and their respective discount / equilibrium / premium, so you don't have to :)
IPDA stands for Interbank Price Delivery Algorithm. Said algorithm appears to be referencing the past 20, 40, and 60 days intervals as points of reference to define ranges and related PD arrays.
Intraday traders can find most value in the 20 Day Look Back box, by observing imbalances and points of interest.
Longer term traders can reference the 40 and 60 Day Look Back boxes for a clear indication of current market conditions.
リリースノート
v0.0 - Chart update.リリースノート
v0.1 - Added different ways of displaying the location of price inside the IPDA ranges:> 'Boxes' shows the proper IPDA ranges, plotting boxes on the chart;
> 'Table A' shows whether price is in Discount of Premium for each of the IPDA ranges;
> 'Table B' shows the distance from Equilibrium in percentage or each of the IPDA ranges.
リリースノート
v0.2 - 'Table B' shows the location of price in percentage for each of the IPDA ranges, where 0% is deep Discount and 100% is high Premium.リリースノート
- Bug Fix: boxes were displaying on lower timeframes. Restricted to 1D chart.リリースノート
Bug Fix: IPDA Low and High was not checking the 20th, 40th and 60th candle.Cosmetics: Added a Line for Equilibrium instead of using the boxes for better visualization and customization.
リリースノート
Major Features Added: – Plot Daily IPDA Data Ranges on any LTF
– Plot LTF IPDA Data Ranges (last 20, 40, 60 LTF candles)
リリースノート
Bug Fix: resolved all issues with boxes plots from previous update!リリースノート
Bug Fix: now plotting from previous day.リリースノート
Fixed Bar Countリリースノート
Added Alertsオープンソーススクリプト
TradingViewの精神に則り、このスクリプトの作者はコードをオープンソースとして公開してくれました。トレーダーが内容を確認・検証できるようにという配慮です。作者に拍手を送りましょう!無料で利用できますが、コードの再公開はハウスルールに従う必要があります。
homo faber fortunæ suæ
免責事項
この情報および投稿は、TradingViewが提供または推奨する金融、投資、トレード、その他のアドバイスや推奨を意図するものではなく、それらを構成するものでもありません。詳細は利用規約をご覧ください。
オープンソーススクリプト
TradingViewの精神に則り、このスクリプトの作者はコードをオープンソースとして公開してくれました。トレーダーが内容を確認・検証できるようにという配慮です。作者に拍手を送りましょう!無料で利用できますが、コードの再公開はハウスルールに従う必要があります。
homo faber fortunæ suæ
免責事項
この情報および投稿は、TradingViewが提供または推奨する金融、投資、トレード、その他のアドバイスや推奨を意図するものではなく、それらを構成するものでもありません。詳細は利用規約をご覧ください。