OPEN-SOURCE SCRIPT
更新済 One For All - xMAs : wave ribbon + trend strenght + xMAcross
This script is not intended to bring anything new or original, but mainly for educational purposes and aesthetic visualization of 10 moving average behavior.
Main features :
Also it is designed to be easily customizeable as the settings allow to:
Trend Strenght explanation :
Overall, this means that the opacity of the triangles represent trend strenght and a fading trend is shown by the color fading into a translucid orange color
p.s. : If you would like to see some other MA calculation method included, please comment below, I'd be happy to update this script
Main features :
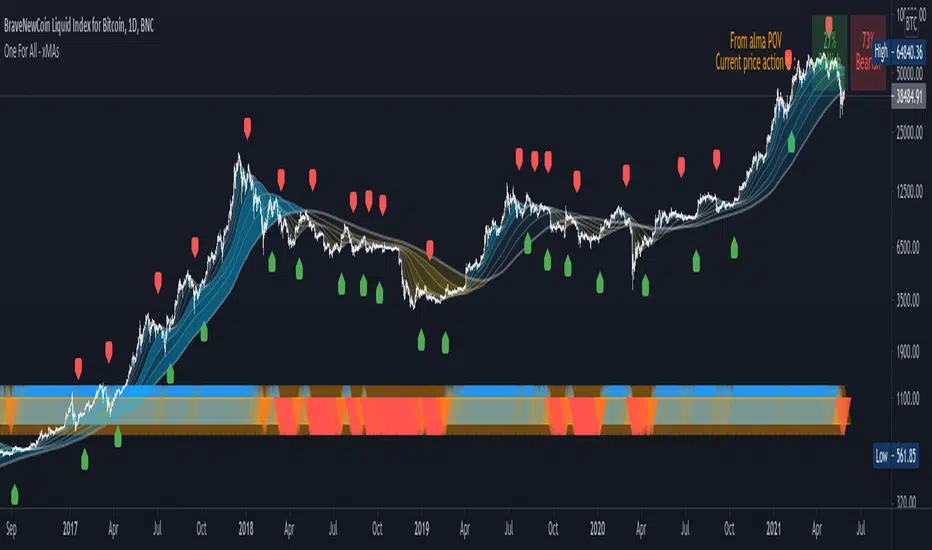
- Moving Averages : as shown by the wave ribbon (the gradient colored areas opacity is correlated with the distance from the Nth xMA to the last xMA)
- Trend Strenght : as shown by the blue/orange/red triangle shape plotted at the bottom of the chart
- Moving Average Cross Signal : as shown by the labels green LabelUp and red LabelDown
Also it is designed to be easily customizeable as the settings allow to:
- Chose different smoothing method for the 10 xMAs plotted
- Manually setup the length of each xMA or simply select a predefined list of convenient length
- Choose different MA length not only for crossover but also for crossunder
Trend Strenght explanation :
- When all the "fast xMA" are above "slow xMA" there is an opaque Blue UpTriangle plotted at bottom (bull trend)
- As more "fast xMA" fall/cross below "slow xMA", the Blue UpTriangle will start fading to a translucid orange UpTriangle
- As even more "fast xMA" fall/cross below "slow xMA", a Red DownTriangle is plotted insteand and become more and more opaque as more MA fall below others
Overall, this means that the opacity of the triangles represent trend strenght and a fading trend is shown by the color fading into a translucid orange color
p.s. : If you would like to see some other MA calculation method included, please comment below, I'd be happy to update this script
リリースノート
- Adding the Pine Table feature to display the current Bulls & Bears presence on the battlefield, and also remind of the smoothing method used. This helps explicit the current trend strength better than opacity of the TriangleUp/Down heatmap displayed at bottom, which remains to help assess historic trend evolution.
- Adding some comments to explicit some functions/blocks
p.s.: tbh, the main reason for this update was originally to change a horrible typo on the title
オープンソーススクリプト
TradingViewの精神に則り、このスクリプトの作者はコードをオープンソースとして公開してくれました。トレーダーが内容を確認・検証できるようにという配慮です。作者に拍手を送りましょう!無料で利用できますが、コードの再公開はハウスルールに従う必要があります。
免責事項
この情報および投稿は、TradingViewが提供または推奨する金融、投資、トレード、その他のアドバイスや推奨を意図するものではなく、それらを構成するものでもありません。詳細は利用規約をご覧ください。
オープンソーススクリプト
TradingViewの精神に則り、このスクリプトの作者はコードをオープンソースとして公開してくれました。トレーダーが内容を確認・検証できるようにという配慮です。作者に拍手を送りましょう!無料で利用できますが、コードの再公開はハウスルールに従う必要があります。
免責事項
この情報および投稿は、TradingViewが提供または推奨する金融、投資、トレード、その他のアドバイスや推奨を意図するものではなく、それらを構成するものでもありません。詳細は利用規約をご覧ください。