OPEN-SOURCE SCRIPT
APC Companion – Volume Accumulation/Distribution
Indicator Description (TradingView – Open Source)
APC Companion – Volume Accumulation/Distribution Filter
(Designed to work standalone or together with the APC Compass)
What this indicator does
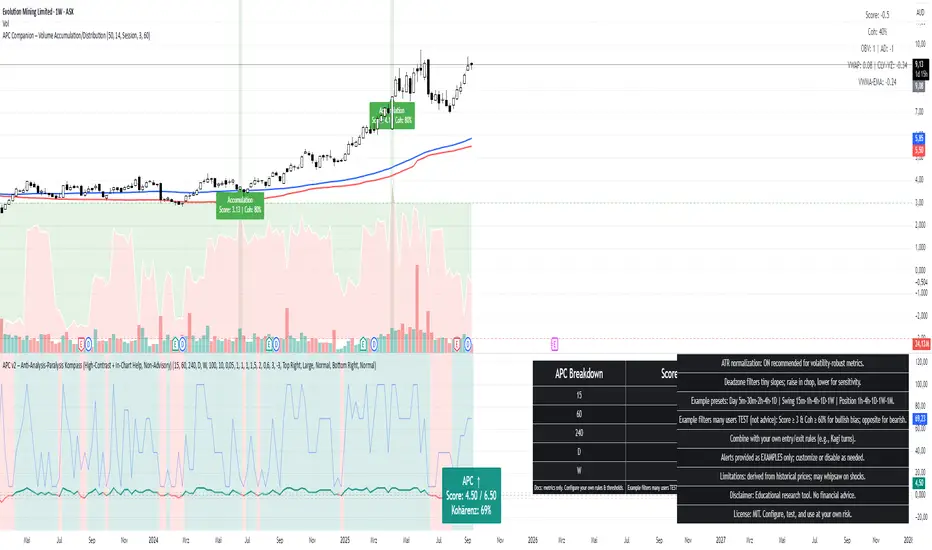
The APC Companion measures whether markets are under Accumulation (buying pressure) or Distribution (selling pressure) by combining:
Chaikin A/D slope – volume flow into price moves
On-Balance Volume momentum – confirms trend strength
VWAP spread – price vs. fair value by traded volume
CLV × Volume Z-Score – detects intrabar absorption / selling pressure
VWMA vs. EMA100 – confirms whether weighted volume supports price action
The result is a single Acc/Dist Score (−5 … +5) and a Coherence % showing how many signals agree.
How to interpret
Score ≥ +3 & Coherence ≥ 60% → Accumulation (green) → market supported by buyers
Score ≤ −3 & Coherence ≥ 60% → Distribution (red) → market pressured by sellers
Anything in between = neutral (no strong bias)
Using with APC Compass
Long trades: Only take Compass Long signals when Companion shows Accumulation.
Short trades: Only take Compass Short signals when Companion shows Distribution.
Neutral Companion: Skip or reduce size if there is no confirmation.
This filter greatly reduces false signals and improves trade quality.
Best practice
Swing trading: 4H / 1D charts, lenZ 40–80, lenSlope 14–20
Intraday: 5m–30m charts, lenZ 20–30, lenSlope 10–14
Position sizing: Increase with higher Coherence %, reduce when below 60%
Exits: Reduce or close if Score drops back to neutral or flips opposite
Disclaimer
This script is published open source for educational purposes only.
It is not financial advice. Test thoroughly before using in live trading.
APC Companion – Volume Accumulation/Distribution Filter
(Designed to work standalone or together with the APC Compass)
What this indicator does
The APC Companion measures whether markets are under Accumulation (buying pressure) or Distribution (selling pressure) by combining:
Chaikin A/D slope – volume flow into price moves
On-Balance Volume momentum – confirms trend strength
VWAP spread – price vs. fair value by traded volume
CLV × Volume Z-Score – detects intrabar absorption / selling pressure
VWMA vs. EMA100 – confirms whether weighted volume supports price action
The result is a single Acc/Dist Score (−5 … +5) and a Coherence % showing how many signals agree.
How to interpret
Score ≥ +3 & Coherence ≥ 60% → Accumulation (green) → market supported by buyers
Score ≤ −3 & Coherence ≥ 60% → Distribution (red) → market pressured by sellers
Anything in between = neutral (no strong bias)
Using with APC Compass
Long trades: Only take Compass Long signals when Companion shows Accumulation.
Short trades: Only take Compass Short signals when Companion shows Distribution.
Neutral Companion: Skip or reduce size if there is no confirmation.
This filter greatly reduces false signals and improves trade quality.
Best practice
Swing trading: 4H / 1D charts, lenZ 40–80, lenSlope 14–20
Intraday: 5m–30m charts, lenZ 20–30, lenSlope 10–14
Position sizing: Increase with higher Coherence %, reduce when below 60%
Exits: Reduce or close if Score drops back to neutral or flips opposite
Disclaimer
This script is published open source for educational purposes only.
It is not financial advice. Test thoroughly before using in live trading.
オープンソーススクリプト
TradingViewの精神に則り、このスクリプトの作者はコードをオープンソースとして公開してくれました。トレーダーが内容を確認・検証できるようにという配慮です。作者に拍手を送りましょう!無料で利用できますが、コードの再公開はハウスルールに従う必要があります。
免責事項
この情報および投稿は、TradingViewが提供または推奨する金融、投資、トレード、その他のアドバイスや推奨を意図するものではなく、それらを構成するものでもありません。詳細は利用規約をご覧ください。
オープンソーススクリプト
TradingViewの精神に則り、このスクリプトの作者はコードをオープンソースとして公開してくれました。トレーダーが内容を確認・検証できるようにという配慮です。作者に拍手を送りましょう!無料で利用できますが、コードの再公開はハウスルールに従う必要があります。
免責事項
この情報および投稿は、TradingViewが提供または推奨する金融、投資、トレード、その他のアドバイスや推奨を意図するものではなく、それらを構成するものでもありません。詳細は利用規約をご覧ください。