OPEN-SOURCE SCRIPT
Pipe tops & bottoms v1.0

This indicator detects Pipe Tops and Pipe Bottoms chart patterns, using the concept described by Thomas Bulkowski: Tops, Bottoms.
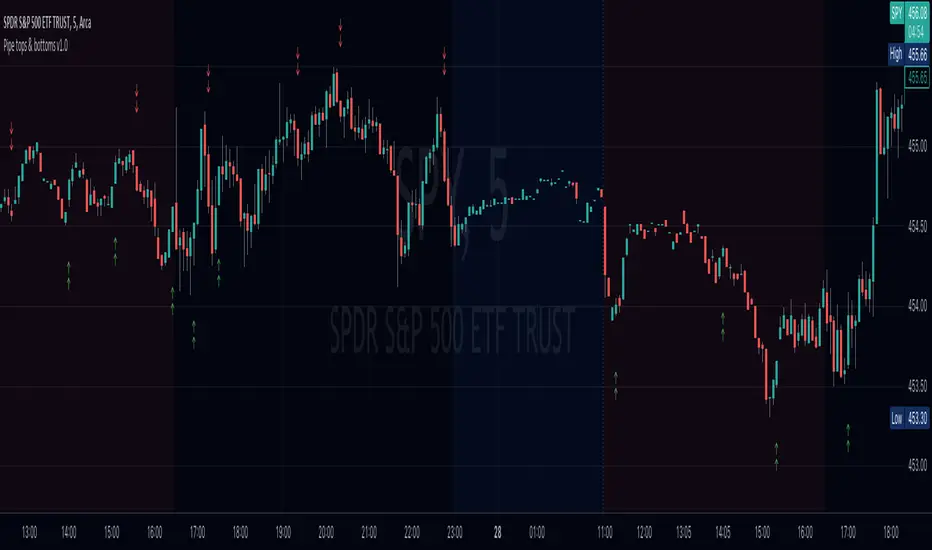
Pipe tops and bottoms patterns are marked on the chart. You can change the indicator sensitivity by using the main settings which define detected price variation boundaries. This will lead to more dense or sparse pattern detection.
Once the bar following each detected top or bottom pattern satisfies signal condition (the current close price must be higher than the high of the pipe bottom, or lower than the low of the pipe top), these bars are also marked on the chart and can be used to define potential long or short entry points.
You can optionally choose to show only signal marks on the chart (this is preferable to avoid visual cluttering), or both pattern and signal marks.
Script calculations are based on the 'Pipe Bottoms Indicator Based on Thomas Bulkowski's Theories' indicator developed by BoilderRoomColdCaller in 2020.
オープンソーススクリプト
TradingViewの精神に則り、このスクリプトの作者はコードをオープンソースとして公開してくれました。トレーダーが内容を確認・検証できるようにという配慮です。作者に拍手を送りましょう!無料で利用できますが、コードの再公開はハウスルールに従う必要があります。
免責事項
この情報および投稿は、TradingViewが提供または推奨する金融、投資、トレード、その他のアドバイスや推奨を意図するものではなく、それらを構成するものでもありません。詳細は利用規約をご覧ください。
オープンソーススクリプト
TradingViewの精神に則り、このスクリプトの作者はコードをオープンソースとして公開してくれました。トレーダーが内容を確認・検証できるようにという配慮です。作者に拍手を送りましょう!無料で利用できますが、コードの再公開はハウスルールに従う必要があります。
免責事項
この情報および投稿は、TradingViewが提供または推奨する金融、投資、トレード、その他のアドバイスや推奨を意図するものではなく、それらを構成するものでもありません。詳細は利用規約をご覧ください。