OPEN-SOURCE SCRIPT
更新済 Urika Trend Strength
The Urika Directional Strength (UDS) indicator calculates and visualizes the strength of the directional trend in the price data. It helps traders see the strength and direction of the trend and allows them to make informed trading decisions based on trend changes.
Calculation:
The Simple Moving Average is used to determine the upper and lower directional bands by adding and subtracting the product of the standard deviation of the price data and the multiplier of the moving average.
Direction: The upward directional trend and downward directional trend are calculated by taking the absolute value of the difference between the price data and the upper and lower directional bands, divided by the product of the standard deviation and the multiplier.
Strength: It is calculated by taking the absolute value of the difference between the price data and the moving average, divided by the product of the standard deviation and the multiplier.
Interpretation:
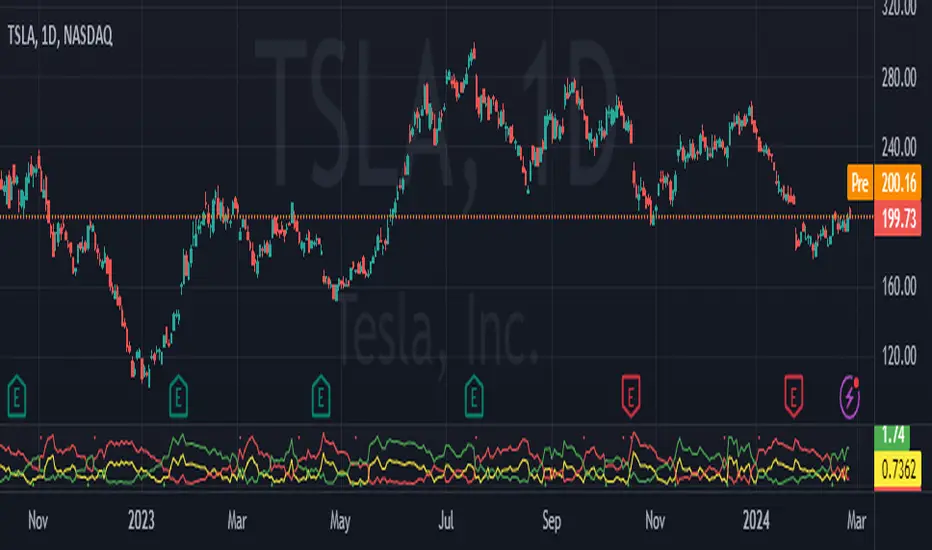
Direction: The position of the long and short lines at the top indicates the direction of the ticker. Long line for long position and Short line for short position.
Strength: When the Strength line is below the directional lines, it is a weak trend or consolidating. If it stays in between the two directional lines, it is a strong trend.
Calculation:
The Simple Moving Average is used to determine the upper and lower directional bands by adding and subtracting the product of the standard deviation of the price data and the multiplier of the moving average.
Direction: The upward directional trend and downward directional trend are calculated by taking the absolute value of the difference between the price data and the upper and lower directional bands, divided by the product of the standard deviation and the multiplier.
Strength: It is calculated by taking the absolute value of the difference between the price data and the moving average, divided by the product of the standard deviation and the multiplier.
Interpretation:
Direction: The position of the long and short lines at the top indicates the direction of the ticker. Long line for long position and Short line for short position.
Strength: When the Strength line is below the directional lines, it is a weak trend or consolidating. If it stays in between the two directional lines, it is a strong trend.
リリースノート
The Urika Trend Strength (UTS) indicator calculates and visualizes the strength of the directional trend in the price data. It helps traders see the strength and direction of the trend and allows them to make informed trading decisions based on trend changes.Calculation:
The Simple Moving Average is used to determine the upper and lower directional bands by adding and subtracting the product of the standard deviation of the price data and the multiplier of the moving average.
Direction: The upward directional trend and downward directional trend are calculated by taking the absolute value of the difference between the price data and the upper and lower directional bands, divided by the product of the standard deviation and the multiplier.
Strength: It is calculated by taking the absolute value of the difference between the price data and the moving average, divided by the product of the standard deviation and the multiplier.
Interpretation:
Direction: The position of the long and short lines at the top indicates the direction of the ticker. Long line for long position and Short line for short position.
Strength: When the Strength line is below the directional lines, it is a weak trend or consolidating. If it stays in between the two directional lines, it is a strong trend.
リリースノート
I updated the name in the description to reflect that with the code.オープンソーススクリプト
TradingViewの精神に則り、このスクリプトの作者はコードをオープンソースとして公開してくれました。トレーダーが内容を確認・検証できるようにという配慮です。作者に拍手を送りましょう!無料で利用できますが、コードの再公開はハウスルールに従う必要があります。
免責事項
この情報および投稿は、TradingViewが提供または推奨する金融、投資、トレード、その他のアドバイスや推奨を意図するものではなく、それらを構成するものでもありません。詳細は利用規約をご覧ください。
オープンソーススクリプト
TradingViewの精神に則り、このスクリプトの作者はコードをオープンソースとして公開してくれました。トレーダーが内容を確認・検証できるようにという配慮です。作者に拍手を送りましょう!無料で利用できますが、コードの再公開はハウスルールに従う必要があります。
免責事項
この情報および投稿は、TradingViewが提供または推奨する金融、投資、トレード、その他のアドバイスや推奨を意図するものではなく、それらを構成するものでもありません。詳細は利用規約をご覧ください。