OPEN-SOURCE SCRIPT
更新済 Position Tracker
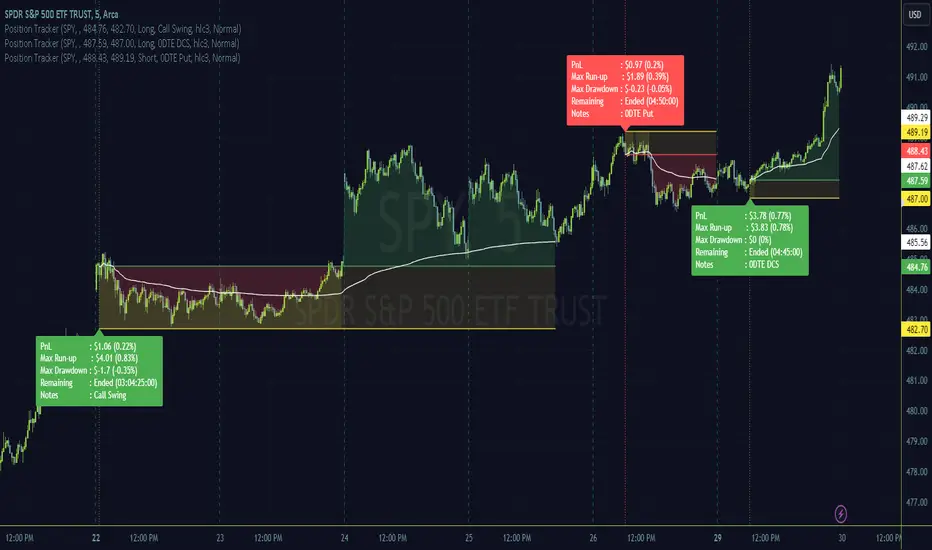
Use this tool to plot a trading position on the chart, using the guided confirmation prompts after adding to the chart.
To use this tool, after adding to the chart it will prompt for entry and exit time and entry price selection which will require using a mouse or touch screen to complete the action; the prompts appear at the bottom of the chart and are a blue bubble/box looking object :)
It will provide a readout of the live profit and loss, run-up and drawdown of a trade as well as present notes if added.
Visuals provide an easy look at periods of drawdown, and a anchored vwap is included as a simple guide for trade management.
Setting the symbol will allow many instances of the tool on the same layout and each instance will hide it's display while not on the matching symbol chart.
Once the end time for the trade is met, the label with trade breakdown thoughtfully moves away from active price and can be seen by scrolling to trade entry area.
If there's enough interest I will add some additional features but wanted to start simple. Or feel free to copy and make it your own!
Thanks and happy trading.
リリースノート
Ensuring I've not broken any house rules, no actual functionality adjustments.オープンソーススクリプト
TradingViewの精神に則り、このスクリプトの作者はコードをオープンソースとして公開してくれました。トレーダーが内容を確認・検証できるようにという配慮です。作者に拍手を送りましょう!無料で利用できますが、コードの再公開はハウスルールに従う必要があります。
@tradeseekers (YouTube, Twitter)
免責事項
この情報および投稿は、TradingViewが提供または推奨する金融、投資、トレード、その他のアドバイスや推奨を意図するものではなく、それらを構成するものでもありません。詳細は利用規約をご覧ください。
オープンソーススクリプト
TradingViewの精神に則り、このスクリプトの作者はコードをオープンソースとして公開してくれました。トレーダーが内容を確認・検証できるようにという配慮です。作者に拍手を送りましょう!無料で利用できますが、コードの再公開はハウスルールに従う必要があります。
@tradeseekers (YouTube, Twitter)
免責事項
この情報および投稿は、TradingViewが提供または推奨する金融、投資、トレード、その他のアドバイスや推奨を意図するものではなく、それらを構成するものでもありません。詳細は利用規約をご覧ください。