OPEN-SOURCE SCRIPT
PnL Portfolio
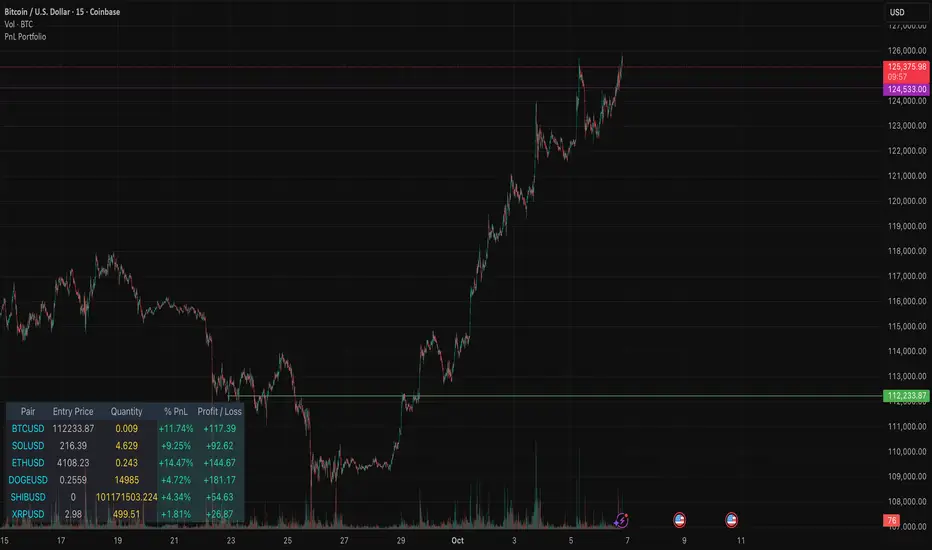
This indicator provides a comprehensive, real-time overview of your open trading portfolio directly on the chart. It allows you to track up to 20 different trading pairs simultaneously.
For each asset, simply input the Pair Symbol, Average Entry Price, and Position Quantity. The script securely fetches the current market price and dynamically calculates and displays a customizable table showing:
Real-Time Profit/Loss ($)
Percentage PnL (%)
Entry Price and Position Quantity
The table uses color coding to clearly highlight profitable (green) or losing (red) positions, and its location on the chart (top/bottom, left/right) is fully adjustable.
オープンソーススクリプト
TradingViewの精神に則り、このスクリプトの作者はコードをオープンソースとして公開してくれました。トレーダーが内容を確認・検証できるようにという配慮です。作者に拍手を送りましょう!無料で利用できますが、コードの再公開はハウスルールに従う必要があります。
免責事項
この情報および投稿は、TradingViewが提供または推奨する金融、投資、トレード、その他のアドバイスや推奨を意図するものではなく、それらを構成するものでもありません。詳細は利用規約をご覧ください。
オープンソーススクリプト
TradingViewの精神に則り、このスクリプトの作者はコードをオープンソースとして公開してくれました。トレーダーが内容を確認・検証できるようにという配慮です。作者に拍手を送りましょう!無料で利用できますが、コードの再公開はハウスルールに従う必要があります。
免責事項
この情報および投稿は、TradingViewが提供または推奨する金融、投資、トレード、その他のアドバイスや推奨を意図するものではなく、それらを構成するものでもありません。詳細は利用規約をご覧ください。